ReactJS - Profiler API
分析是一种重要的技术,用于收集和显示特定函数在实时环境中执行所花费的时间。分析通常用于查找应用程序中的性能瓶颈。React 提供了两个选项来分析 React 应用程序
Profiler 组件
Profiler DevTools
Profiler 组件
React Profiler 组件只是另一个用于记录 React 组件的分析信息的 React 组件。Profiler 组件可以在 React 元素树中的任何位置使用。React 接受多个分析器和分析器的多级嵌套。本章让我们检查一下签名以及如何在 React 应用程序中应用 Profiler。
Profiler 组件的签名
Profiler 组件可以嵌套任何 React 组件,需要两个 props,
id
Profiler 组件的标识符
onRender 回调函数
组件渲染每个阶段调用的回调函数
回调函数的签名如下 −
function onRenderCallback(
   id,
   phase,
   actualDuration,
   baseDuration,
   startTime,
   commitTime,
   interactions
){
   // 使用分析器信息执行任何操作
}
在控制台中记录分析数据的一个回调函数实现示例如下 −
const logProfilerData = (id, phase, actualTime, baseTime, startTime, commitTime) => {
   console.log(`${id}'s ${phase} phase:`);
   console.log(`Actual time: ${actualTime}`);
   console.log(`Base time: ${baseTime}`);
   console.log(`Start time: ${startTime}`);
   console.log(`Commit time: ${commitTime}`);
};
应用 Profiler
让我们创建一个新的 React 应用程序来学习如何在本节中应用 Profiler 组件。
首先,创建一个新的 React 应用程序并使用以下命令启动它。
create-react-app myapp
cd myapp
npm start
接下来,打开 App.css (src/App.css) 并删除所有 CSS 类。
// 删除所有 css 类
接下来,创建一个简单的 hello 组件 Hello (src/Components/Hello.js) 并呈现一条简单的消息,如下所示 −
import React from "react";
class Hello extends React.Component {
   constructor(props) {
      super(props)
   }
   render() {
      return (
         <div>Hello, {this.props.name}</div>
      );
   }
}
export default Hello;
这里,
使用 name 属性来呈现具有给定名称的 hello 消息
接下来,打开 App 组件 (src/App.js),并使用分析器组件,如下所示 −
import './App.css'
import React, { Profiler } from 'react';
import Hello from './Components/Hello'
const logProfilerData = (id, phase, actualTime, baseTime, startTime, commitTime) => {
   console.log(`${id}'s ${phase} phase:`);
   console.log(`Actual time: ${actualTime}`);
   console.log(`Base time: ${baseTime}`);
   console.log(`Start time: ${startTime}`);
   console.log(`Commit time: ${commitTime}`);
};
function App() {
   return (
      <div className="container">
         <div style={{ padding: "10px" }}>
            <div>
               <Profiler id="helloWorld" onRender={logProfilerData}>
                  <Hello name="World" />
               </Profiler>
            </div>
         </div>
      </div>
   );
}
export default App;
这里,
从 react 包中导入 Profiler 组件
通过使用 Profiler 组件包装 Hello 组件来使用它
创建一个回调函数 logProfilerData 并将所有分析器数据发送到控制台
在 Profiler 组件的 onRender props 中设置 logProfilerData 回调函数
最后,在浏览器中打开应用程序并检查最终结果。它将呈现 hello 组件,如下所示 −
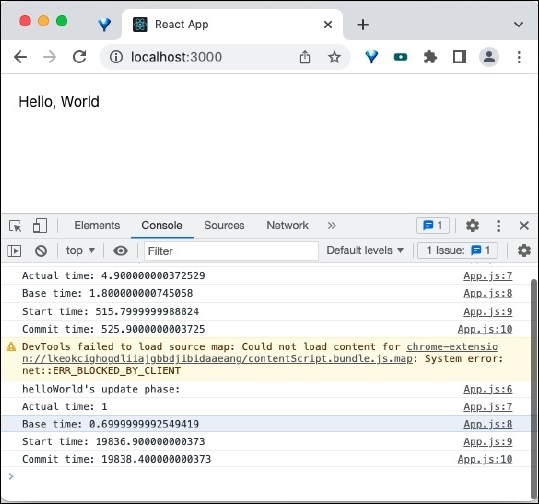
打开控制台,您可以看到分析器信息,如下所示 −
helloWorld's mount phase:
App.js:7 Actual time: 4.900000000372529
App.js:8 Base time: 1.800000000745058
App.js:9 Start time: 515.7999999988824
App.js:10 Commit time: 525.9000000003725
...
App.js:6 helloWorld's update phase:
App.js:7 Actual time: 1
App.js:8 Base time: 0.6999999992549419
App.js:9 Start time: 19836.900000000373
App.js:10 Commit time: 19838.400000000373
Profiler React DevTools
React DevTools 插件为分析器引入了一个单独的部分。开发人员可以打开"Profiler"选项卡并获得有关应用程序的大量有用见解。分析器 DevTools 中的一些可用功能如下 −
浏览提交
过滤提交
火焰图
排名图
组件图
结论
React 分析器组件和分析器 devtools 是分析和优化 React 应用程序不可或缺的强大工具。


