Chart.js - 标题
Chart.js 标题定义哪些文本将显示在图表或图形的顶部。 Title 配置的命名空间是 options.plugins.title,而图表标题的全局选项在 Chart.defaults.plugins.title 中定义。
下表给出了可用于图表标题的各种配置选项的描述 −
| 名称 | 类型 | 默认 | 描述 |
|---|---|---|---|
| align | string | 'center' | 顾名思义,使用此配置可以设置标题的对齐方式。 |
| color | Color | Chart.defaults.color | 它将定义文本颜色。 |
| display | Boolean | false | 如果为 true,则显示标题,否则不显示。 |
| fullSize | Boolean | true | 顾名思义,如果为 true,则框将占据画布的整个宽度/高度。 |
| position | string | 'top' | 用于设置标题的位置。默认为顶部位置。 |
| font | 字体 | {weight: 'bold'> | 您可以使用各种字体。选项位于"Chart.defaults.font"中。 |
| padding | Padding | 10 | 用于在标题周围应用填充。 |
| text | string|string[] | '' | 顾名思义,它用于显示标题文本。 |
语法
图表标题语法如下 −
title: {
   display: true,
   text: 'write heading here',
   color: 'navy',
   position: 'bottom',
}
标题 enabled 属性必须为 true 才能显示数据标签。如果将其设置为 false,则 title 将被停用。
示例
让我们举一个例子,其中我们将使用各种 Title 配置 −
<!DOCTYPE>
<html>
<head>
   <meta charset- "UTF-8" />
   <meta name="viewport" content="width=device-width, initial-scale=1" />
   <title>chart.js</title>
</head>
<body>
   <canvas id="chartId" aria-label="chart" height="350" width="580"></canvas>
   <script src="https://cdnjs.cloudflare.com/ajax/libs/Chart.js/3.1.1/chart.min.js"></script>
   <script>
      var chrt = document.getElementById("chartId").getContext("2d");
      var chartId = new Chart(chrt, {
         type: 'bar',
         data: {
            labels: ["HTML", "CSS", "JAVASCRIPT", "CHART.JS", "JQUERY", "BOOTSTRP"],
            datasets: [{
               label: "online tutorial subjects",
               data: [20, 40, 30, 35, 30, 20],
               backgroundColor: ['coral', 'aqua', 'pink', 'lightgreen', 'lightblue', 'crimson'],
               borderColor: ['red', 'blue', 'fuchsia', 'green', 'navy', 'black'],
               borderWidth: 2,
            }],
         },
         options: {
            responsive: false,
            plugins: {
               title: {
                  display: true,
                  text: 'Web Application Technologies',
                  color: 'navy',
                  position: 'bottom',
                  align: 'center',
                  font: {
                     weight: 'bold'
                  },
                  padding: 8,
                  fullSize: true,
               }
            }
         },
      });
   </script>
</body>
</html>
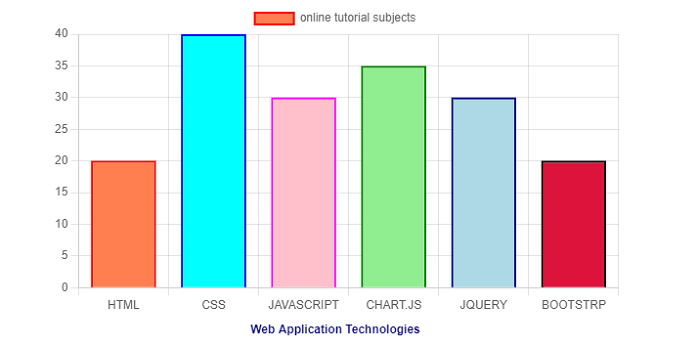
输出
以下输出图表显示了各种标题配置 −