Chart.js - 分类轴
轴是任何图表或图形不可或缺的一部分。与笛卡尔轴一样,分类轴也是图表的重要组成部分。
下面给出了全局定义分类轴的语法 −
let chart = new Chart(ctx, {
   type: ...
   data: {
      labels: ['January', 'February', 'March', 'April', 'May', 'June'],
      datasets: ...
   }
});
我们可以将类别轴定义为轴的一部分,如下所示 −
let chart = new Chart(ctx, {
   type: ...
   data: ...
   options: {
      scales: {
         x: {
            type: 'category',
            labels: ['January', 'February', 'March', 'April', 'May', 'June']
         }
      }
   }
});
示例
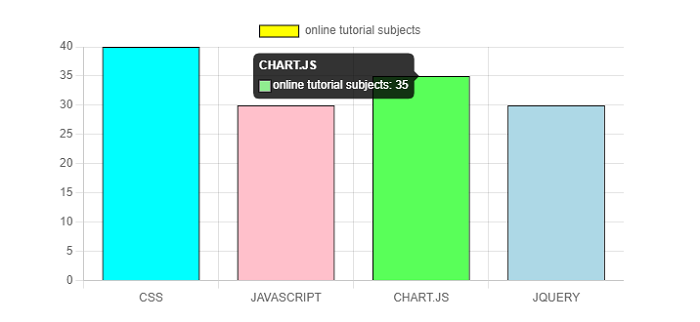
我们来举个例子,使用分类轴来创建图表 −
<!DOCTYPE>
<html>
<head>
   <meta charset- "UTF-8" />
   <meta name="viewport" content="width=device-width, initial-scale=1" />
   <title>chart.js</title>
</head>
<body>
   <canvas id="chartId" aria-label="chart" height="300" width="580"></canvas>
   <script src="https://cdnjs.cloudflare.com/ajax/libs/Chart.js/3.1.1/chart.min.js"></script>
   <script src="https://cdnjs.cloudflare.com/ajax/libs/Chart.js/3.1.1/helpers.esm.min.js"></script>
   <script>
      var chrt = document.getElementById("chartId").getContext("2d");
      var chartId = new Chart(chrt, {
         type: 'bar',
         data: {
            labels: ["HTML", "CSS", "JAVASCRIPT", "CHART.JS", "JQUERY", "BOOTSTRP"],
            datasets: [{
               label: "online tutorial subjects",
               data: [20, 40, 30, 35, 30, 20],
               backgroundColor: ['yellow', 'aqua', 'pink', 'lightgreen', 'lightblue', 'gold'],
               borderColor: ['black'],
               borderWidth: 1,
               pointRadius: 4,
            }],
         },
         options: {
            responsive: false,
            scales: {
               x: {
                  min: 'CSS',
                  max: 'JQUERY'
               }
            }
         },
      });
   </script>
</body>
</html>
输出