MATLAB Simulink - 导出数据
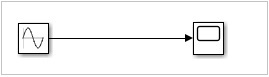
在本章中,我们将学习如何在 MATLAB 中使用 Simulink 输出结果。 让我们尝试一个简单的正弦波模型,如下所示 −
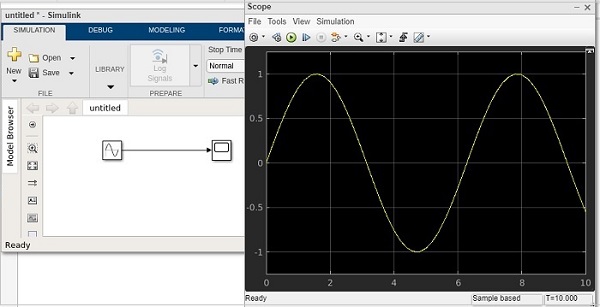
当我们运行模型时,示波器显示正弦波,如下所示 −
现在要获取正弦波的数据,请转到配置属性并选择日志记录选项卡。
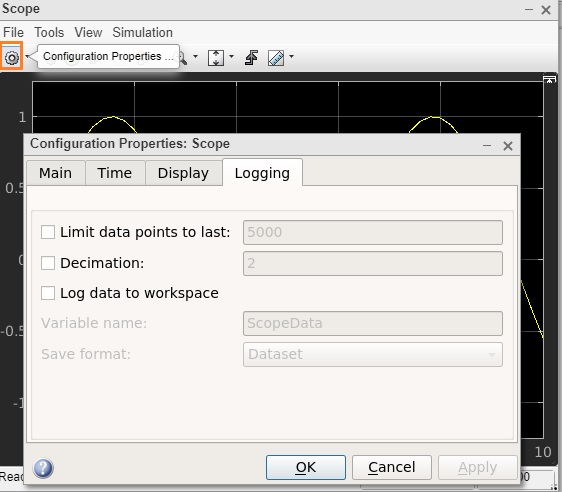
选中日志数据到工作区复选框,如下所示 −
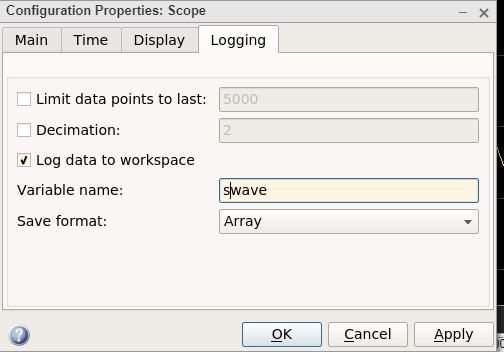
设置您选择的变量名称。 在这里,我们将名称指定为 swave,并将保存格式指定为 Array。 单击"确定"按钮并再次运行模拟。
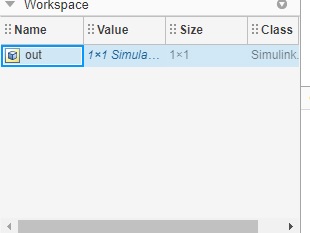
您应该在工作区中看到输出
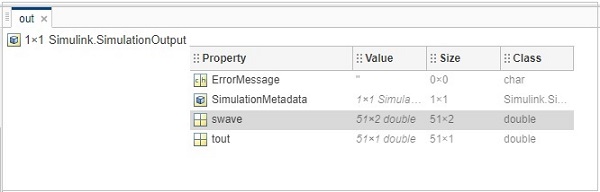
双击,它会显示我们之前保存的 swave 变量的详细信息。
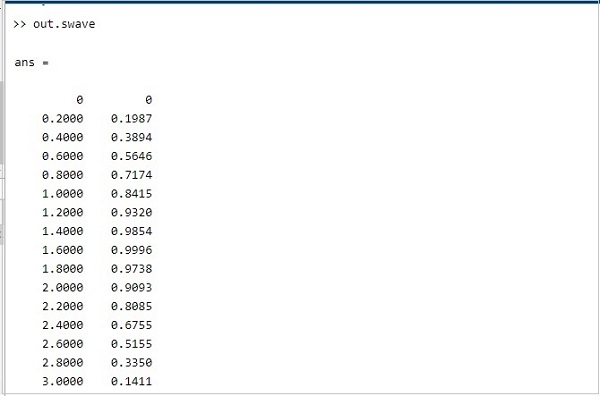
在命令提示符下输入.swave,它会给你如下所示的输出 −
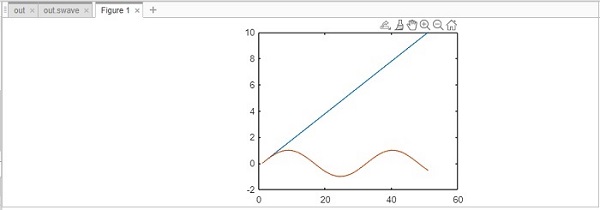
Y您可以使用绘图命令绘制正弦波,如下所示 −
图表如下所示 −