如何在 mplot3d(matplotlib + python)中获取拾取对象的属性?
matplotlibpythondata visualization
要获取 matplotlib 3d 中拾取对象的属性,我们可以采取以下步骤。
步骤
设置图形大小并调整子图之间和周围的填充。
创建一个新图形或激活一个现有图形。
将 'ax' 添加到图形作为子图排列的一部分。
制作随机数据点的散点图。
将函数 *pick_event_method* 绑定到事件 *pick_event*。
打印事件的 x、y 和 z 坐标。
要显示图形,请使用 Show() 方法。
示例
import matplotlib.pyplot as plt
import numpy as np

plt.rcParams["figure.figsize"] = [7.00, 3.50]
plt.rcParams["figure.autolayout"] = True

fig = plt.figure()

ax = fig.add_subplot(111, project='3d')

# 散点图
ax.scatter(np.random.rand(10), np.random.rand(10), np.random.rand(10), c=np.random.rand(10),
   cmap='hot', picker=5, s=100)

# pick_event_method
def pick_event_method(event):
   ind = event.ind[0]
   x, y, z = event.artist._offsets3d
   print(x[ind], y[ind], z[ind])

# 将 pick_event_method 与 pick_event 连接起来
fig.canvas.mpl_connect('pick_event', pick_event_method)

plt.show()
输出
它负责产生以下输出 −
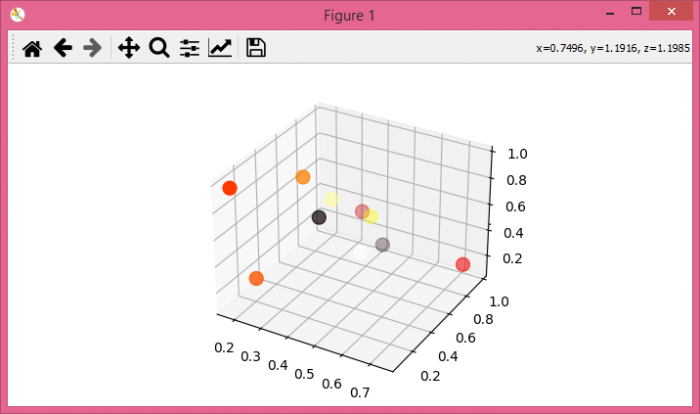
现在,单击图中的对象,它将在控制台上显示这些点的坐标。
0.29471404722373373 0.7272382336952506 0.551701540876738
0.7393059098968329 0.880733225356321 0.20733995579556608
0.4055966753557102 0.9709122739514328 0.10116103589732084
0.2781962334047674 0.48531626106129566 0.8573607199598575


