在 Python Matplotlib 中绘制轮廓直方图
matplotlibpythondata visualization
在轮廓直方图中,每个箱体包含其条目的平均值。要在 Python 中绘制轮廓直方图,我们可以使用 Seaborn 中的 regplot 方法。
步骤
设置图形大小并调整子图之间和周围的填充。
使用 numpy 创建 x 和 y 数据点。
使用 seaborn.regplot 绘制数据和线性回归模型拟合。使用参数 x_bins 将 x 变量分箱到离散箱中。使用 fit_reg=True 绘制与 x 和 y 变量相关的回归模型。
要显示该图,请使用 Show() 方法。
示例
import numpy as np
import seaborn as sns
from matplotlib import pyplot as plt

plt.rcParams["figure.figsize"] = [7.00, 3.50]
plt.rcParams["figure.autolayout"] = True

x = np.random.uniform(-5, 5, 1000)
y = np.random.normal(x**2, np.abs(x) + 1)

sns.regplot(x=x, y=y, x_bins=20, marker='o', fit_reg=True)

plt.show()
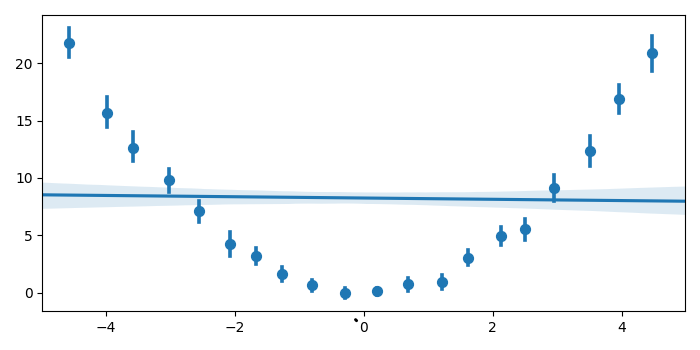
输出
它将产生以下输出 −