如何更改 Matplotlib 中科学计数法的字体大小?
matplotlibpythondata visualization
要更改 matplotlib 中科学计数法的字体大小,我们可以采取以下步骤 −
设置图形大小并调整子图之间和周围的填充。
列出 x 和 y 值。
使用 plot() 方法绘制 x 和 y 数据点。
要更改科学计数法的字体大小,我们可以使用名称为 style="sci" 的类。
要显示图形,请使用 show() 方法。
示例
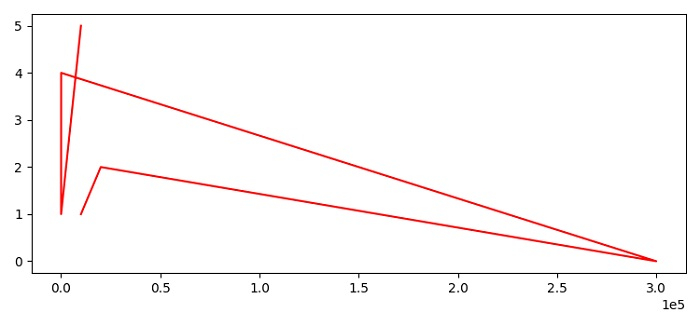
from matplotlib import pyplot as plt

plt.rcParams["figure.figsize"] = [7.50, 3.50]
plt.rcParams["figure.autolayout"] = True

x = [10000, 20000, 300000, 34, 1, 10000]
y = [1, 2, 0, 4, 1, 5]

plt.plot(x, y, color='red')
plt.ticklabel_format(axis="x", style="sci", scilimits=(0, 0))

plt.show()
输出