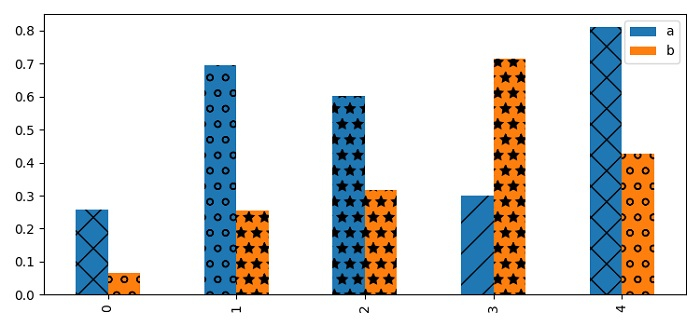
如何使用 Pandas 和 Matplotlib 绘制阴影条?
matplotlibpythondata visualization
要使用 Pandas 绘制阴影条,我们可以采取以下步骤 −
设置图形大小并调整子图之间和周围的填充。
使用 Pandas 制作具有两列的数据框。
将轴添加到当前图形作为子图排列。
按名称制作带有kind="bars"类的图。
制作阴影列表。
使用bars.patches获取条形图补丁。
迭代条补丁并设置阴影每个补丁的。
要显示图形,请使用 show() 方法。
示例
import numpy as np
import pandas as pd
from matplotlib import pyplot as plt

plt.rcParams["figure.figsize"] = [7.50, 3.50]
plt.rcParams["figure.autolayout"] = True

df = pd.DataFrame(np.random.rand(5, 2), columns=['a', 'b'])
ax = plt.figure().add_subplot(111)
bars = df.plot(ax=ax, kind='bar')
hatches = ["*", "/", "o", "x"]

for patch in bars.patches:
   patch.set_hatch(hatches[np.random.randint(10)%len(hatches)])

plt.show()
输出