Jupyter Notebook - 绘图
Jupyter Notebook 的 IPython 内核能够在输入单元格中显示代码图。 它与 matplotlib 库无缝协作。即使未调用绘图对象的 show() 函数,带有 %matplotlib 魔术函数的内联选项也会呈现绘图单元格。 show() 函数使图形显示在下面的 in[] 单元格中,而没有带数字的 out[]。
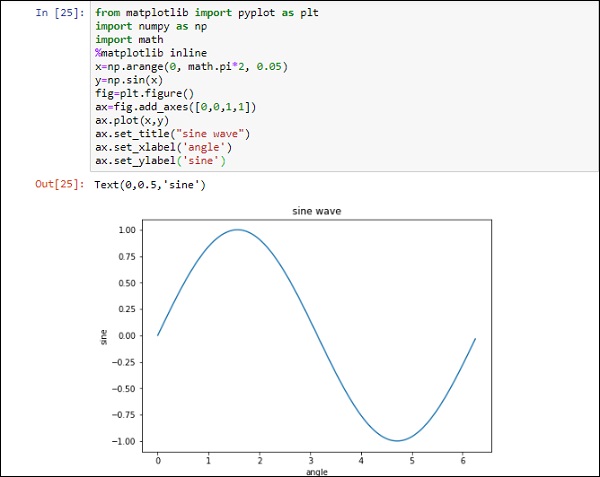
现在,在末尾添加 plt.show() 并再次运行该单元以查看差异。
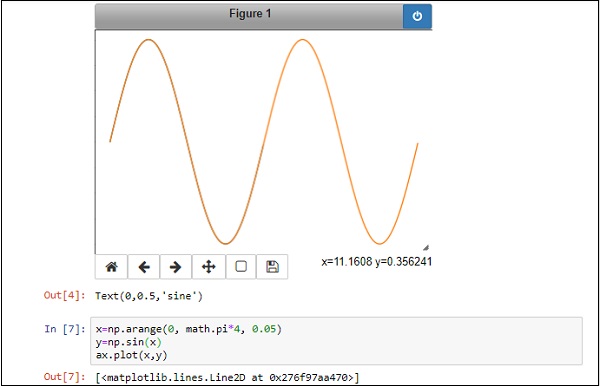
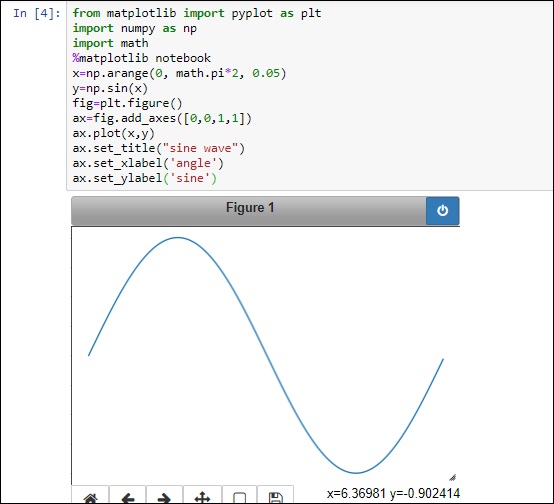
请注意,%matplotlib notebook magic 呈现交互式绘图。
在图下方,您可以找到一个工具栏,用于切换视图、平移、缩放和下载选项。
重要的是,如果您修改图表下方的数据,显示会动态变化,而无需绘制另一张图表。
在上面的例子中,改变下面单元格中x和y的数据集,重新绘制图形,上面的图形会动态刷新。