Chart.js - 混合图表
Chart.js 还为我们提供了创建具有两种或不同图表类型组合的图表的功能。此类图表称为混合图表。chart.js 混合图表最常见的示例之一是包含线数据集的条形图。
语法
创建混合图表的语法如下 −
type: 'scatter',
datasets: [
   { type: 'scatter', data: value, },
   { type: 'bar', data: value, },
]
示例
让我们举一个例子,借助该示例我们将创建一个混合图表 −
<!DOCTYPE>
<html>
<head>
<meta charset- "UTF-8" />
<meta name="viewport" content="width=device-width, initial-scale=1" />
<title>chart.js</title>
</head>
<body>
<canvas id="chartId" aria-label="chart" height="300" width="580"></canvas>
<script src="https://cdnjs.cloudflare.com/ajax/libs/Chart.js/3.1.1/chart.min.js"></script>
<script>
var chrt = document.getElementById("chartId").getContext("2d");
var chartId = new Chart(chrt, {
type: 'scatter',
data: {
labels: ["HTML", "CSS", "JAVASCRIPT", "CHART.JS", "JQUERY", "BOOTSTRP"],
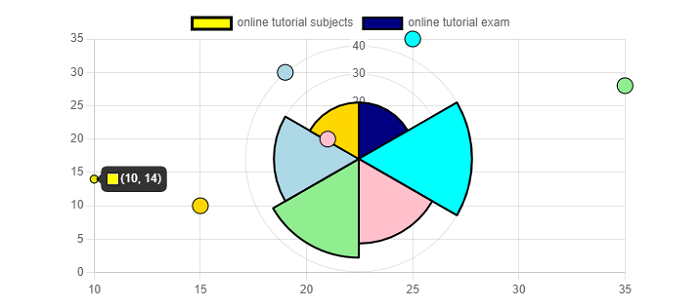
datasets: [{
type: 'scatter',
label: "online tutorial subjects",
data: [
{x:10, y:14},
{x:25, y:35},
{x:21, y:20},
{x:35, y:28},
{x:15, y:10},
{x:19, y:30}
],
backgroundColor: ['yellow', 'aqua', 'pink', 'lightgreen', 'gold', 'lightblue'],
borderColor: ['black'],
radius: 8,
},
{
type: 'polarArea',
label: "online tutorial exam",
data: [20, 40, 30, 35, 30, 20],
backgroundColor: ['navy', 'aqua', 'pink', 'lightgreen', 'lightblue', 'gold'],
borderColor: ['black'],
borderWidth: 2,
pointRadius: 5,
}
],
},
options: {
responsive: false,
scales: {
y: {
beginAtZero: true
}
}
},
});
</script>
</body>
</html>
输出