Matplotlib 中的 set_xlim 和 set_xbound 有什么区别?
matplotlibpythondata visualization
set_xlim − 设置 X 轴视图限制。
set_xbound − 设置 X 轴的下限和上限数值边界。
要设置 xlim 和 xbound,我们可以采取以下步骤 −
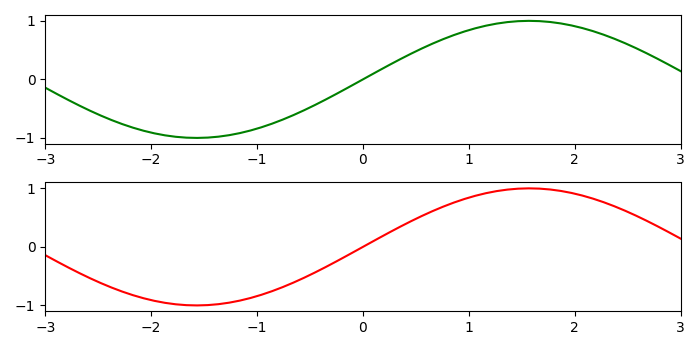
使用 subplots(2),我们可以创建一个图形和一组子图。这里,我们创建了 2 个子图。
使用 numpy 创建 x 和 y 数据点。
使用轴 1,使用 plot() 方法绘制 x 和 y 数据点。
使用 set_xlim() 方法设置 x 限制。
使用轴 2,使用 plot() 方法绘制 x 和 y 数据点。
使用 set_xbound() 方法设置性别 xbound 。
要显示图形,请使用 show() 方法。
示例
import numpy as np
from matplotlib import pyplot as plt
plt.rcParams["figure.figsize"] = [7.00, 3.50]
plt.rcParams["figure.autolayout"] = True
fig, axes = plt.subplots(2)

x = np.linspace(-5, 5, 100)
y = np.sin(x)

axes[0].plot(x, y, c='g')
axes[0].set_xlim(-3, 3)

axes[1].plot(x, y, c='r')
axes[1].set_xbound(-3, 3)

plt.show()
输出