使用 Matplotlib 在 Python 中绘制动画箭筒
matplotlibpythondata visualization
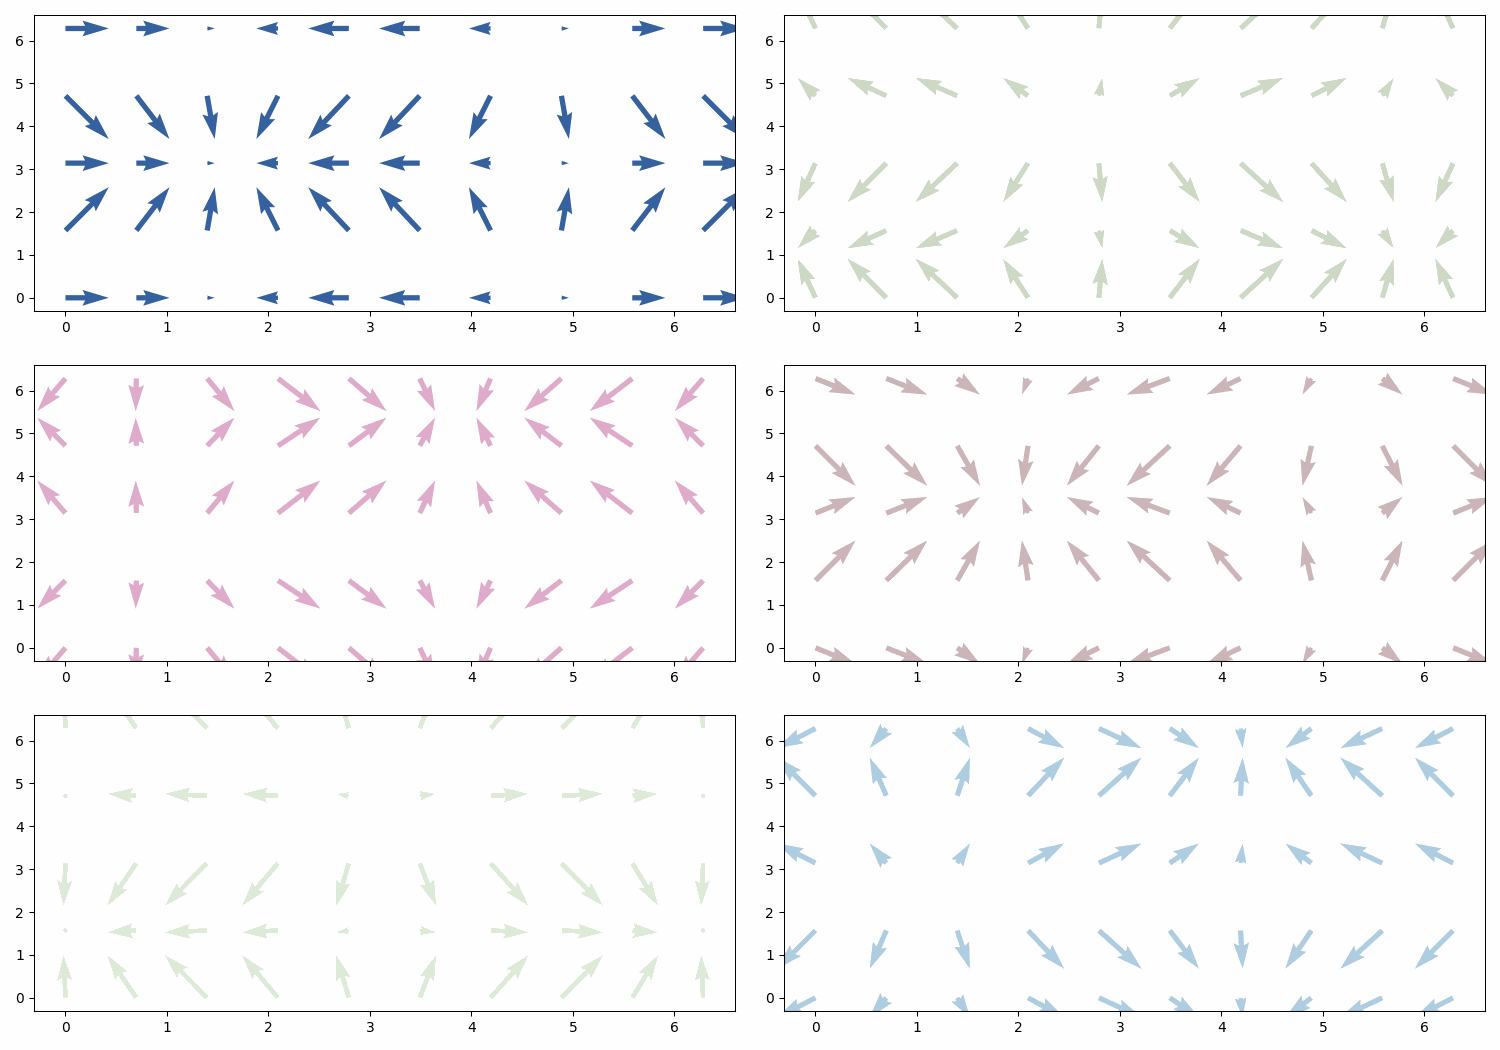
要在 Python 中为箭筒制作动画,我们可以执行以下步骤 −
- 设置图形大小并调整子图之间和周围的填充。
- 使用 numpy 创建 x 和 y 数据点。
- 使用 numpy 创建 u 和 v 数据点。
- 创建一个图形和一组子图。
- 使用 quiver() 方法绘制箭头的 2D 场。
- 要为箭筒制作动画,我们可以在 animate() 方法中更改 u 和 v 值。更新 u 和 v 值以及矢量的颜色。
- 要显示图形,请使用 show() 方法。
示例
import numpy as np
import random as rd
from matplotlib import pyplot as plt, animation

plt.rcParams["figure.figsize"] = [7.50, 3.50]
plt.rcParams["figure.autolayout"] = True

x, y = np.mgrid[:2 * np.pi:10j, :2 * np.pi:5j]
u = np.cos(x)
v = np.sin(y)

fig, ax = plt.subplots(1, 1)
qr = ax.quiver(x, y, u, v, color='red')

def animate(num, qr, x, y):
   u = np.cos(x + num * 0.1)
   v = np.sin(y + num * 0.1)
   qr.set_UVC(u, v)
   qr.set_color((rd.random(), rd.random(), rd.random(), rd.random()))
   return qr,

anim = animation.FuncAnimation(fig, animate, fargs=(qr, x, y),
                              interval=50, blit=False)

plt.show()
输出


