Matplotlib – 如何在鼠标单击时显示某个点的坐标?
matplotlibpythondata visualization
要在 matplotlib 中创建自定义鼠标光标,我们可以采取以下步骤
步骤
设置图形大小并调整子图之间和周围的填充。
创建一个新图形或激活一个现有图形。
将函数 *mouse_event* 绑定到事件 *button_press_event*。
使用 numpy 创建 x 和 y 数据点。
使用 plot() 绘制 x 和 y 数据点方法。
要显示图形,请使用 Show() 方法。
示例
import numpy as np
from matplotlib import pyplot as plt

plt.rcParams["figure.figsize"] = [7.00, 3.50]
plt.rcParams["figure.autolayout"] = True

def mouse_event(event):
    print('x: {} and y: {}'.format(event.xdata, event.ydata))

fig = plt.figure()
cid = fig.canvas.mpl_connect('button_press_event', mouse_event)

x = np.linspace(-10, 10, 100)
y = np.sin(x)

plt.plot(x, y)

plt.show()
输出
它会产生以下输出 −
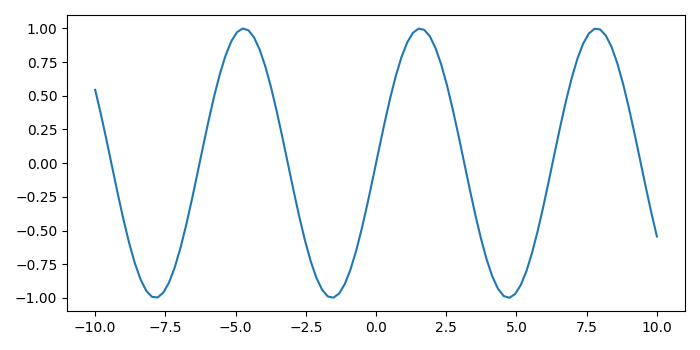
现在,单击图上的不同点,它将在控制台上显示它们的坐标。
x: -3.099305446290094 and y: -0.013811108549791173
x: -0.2865652183685867 and y: -0.2067543563498595
x: -3.0280968329249927 and y: -0.1844916739113902
x: -5.7696284474814 and y: 0.4240216460734405
x: -3.9182044999887626 and y: 0.6837529411889172


