如何在 Matplotlib 中使用 Axes3D 缩放?
matplotlibpythondata visualization
要使用 Axes3D 缩放,我们可以采取以下步骤 −
- 设置图形大小并调整子图之间和周围的填充。
- 使用 figure() 方法创建新图形或激活现有图形。
- 使用 Axes3D(fig) 方法获取 3D 轴对象。
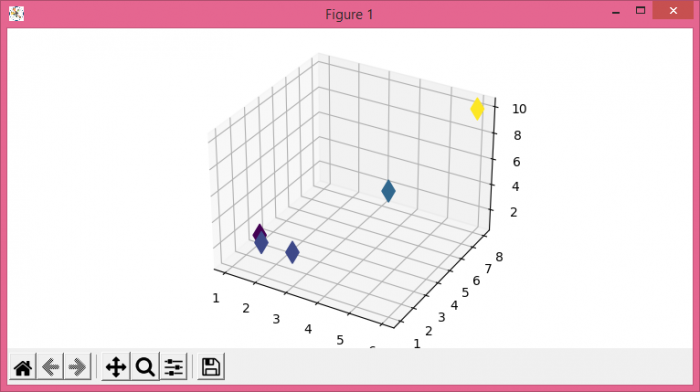
- 使用 scatter() 方法绘制 x、y 和 z 数据点。
- 要显示图形,请使用 show() 方法。
示例
from mpl_toolkits.mplot3d import Axes3D
from matplotlib import pyplot as plt

plt.rcParams["figure.figsize"] = [7.50, 3.50]
plt.rcParams["figure.autolayout"] = True

fig = plt.figure()
ax = Axes3D(fig)
x = [2, 4, 6, 3, 1]
y = [1, 6, 8, 1, 3]
z = [3, 4, 10, 3, 1]

ax.scatter3D(x, y, z, c=z, alpha=1, marker='d', s=150)
plt.show()
输出