如何使用 Matplotlib 在轴标签和图例中以下标形式写入文本?
matplotlibpythondata visualization
要在轴标签和图例中以下标形式写入文本,我们可以采取以下步骤 −
使用 NumPy 创建 x 和 y 数据点。
使用上标文本标签绘制 x 和 y 数据点。
使用 xlabel 和 ylabel 以及文本中的下标 。
使用 xlabel 和 ylabel class="tp-codespan">legend() 方法在图中放置图例。
调整子图之间和周围的填充。
要显示图形,请使用 show() 方法。
示例
import numpy as np
import matplotlib.pyplot as plt
plt.rcParams["figure.figsize"] = [7.00, 3.50]
plt.rcParams["figure.autolayout"] = True
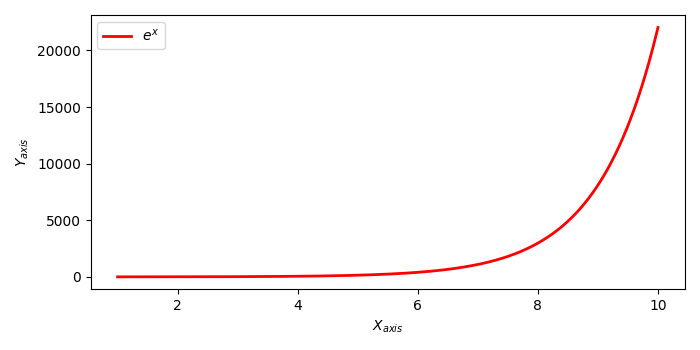
x = np.linspace(1, 10, 1000)
y = np.exp(x)
plt.plot(x, y, label=r'$e^x$', c="red", lw=2)
plt.xlabel("$X_{axis}$")
plt.ylabel("$Y_{axis}$")
plt.legend(loc='upper left')
plt.show()
输出