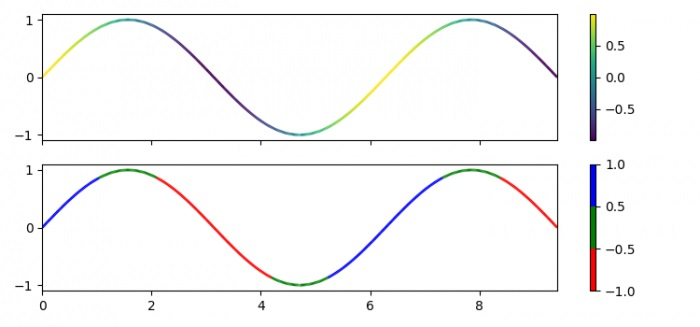
如何在 matplotlib 中根据线图的数据索引改变线条颜色?
matplotlibpythondata visualization
要使 matplotlib 中线图的线条颜色随数据索引而变化,我们可以采取以下步骤 −
步骤
设置图形大小并调整子图之间和周围的填充。
使用 numpy 创建 x 和 y 数据点。
获取较小的限制,dydx。
使用 numpy 获取 points 和 segments 数据点。
创建一个图形和一组子图。
创建一个类,当调用时,将数据线性归一化为一些范围。
从 numpy 数组 *A* 设置图像数组。
设置集合的线宽。
设置轴 1 的颜色条。
从颜色列表(即 r、g 和 b)生成 Colormap 对象。
重复步骤 6、7、8、9 和 10。
设置 X 和 Y 轴的限制。
要显示图形,请使用 show() 方法。
示例
import numpy as np
import matplotlib.pyplot as plt
from matplotlib.collections import LineCollection
from matplotlib.colors import ListedColormap, BoundaryNorm

plt.rcParams["figure.figsize"] = [7.50, 3.50]
plt.rcParams["figure.autolayout"] = True

x = np.linspace(0, 3 * np.pi, 500)
y = np.sin(x)

dydx = np.cos(0.5 * (x[:-1] + x[1:]))
points = np.array([x, y]).T.reshape(-1, 1, 2)
segments = np.concatenate([points[:-1], points[1:]], axis=1)

fig, axs = plt.subplots(2, 1, sharex=True, sharey=True)
norm = plt.Normalize(dydx.min(), dydx.max())

lc = LineCollection(segments, cmap='viridis', norm=norm)
lc.set_array(dydx)
lc.set_linewidth(2)

line = axs[0].add_collection(lc)
fig.colorbar(line, ax=axs[0])
cmap = ListedColormap(['r', 'g', 'b'])
norm = BoundaryNorm([-1, -0.5, 0.5, 1], cmap.N)

lc = LineCollection(segments, cmap=cmap, norm=norm)
lc.set_array(dydx)
lc.set_linewidth(2)

line = axs[1].add_collection(lc)
fig.colorbar(line, ax=axs[1])

axs[0].set_xlim(x.min(), x.max())
axs[0].set_ylim(-1.1, 1.1)

plt.show()
输出
它将产生以下输出 −


