如何使用 Matplotlib 在 Python 中为子图设置相同的比例?
matplotlibpythondata visualization
要使用 Matplotlib 在 Python 中为子图设置相同的比例,我们可以采取以下步骤 −
- 设置图形大小并调整子图之间和周围的填充。
- 创建一个新图形或激活一个现有图形。
- 将 'ax1' 添加到图形中作为子图排列的一部分,其中 nrows=2、ncols=1 和 index=1。
- 添加另一个轴 'ax2'将该图作为子图排列的一部分,其中 nrows=2、ncols=1 和 index=2 共享 X 轴(为子图设置相同的比例)
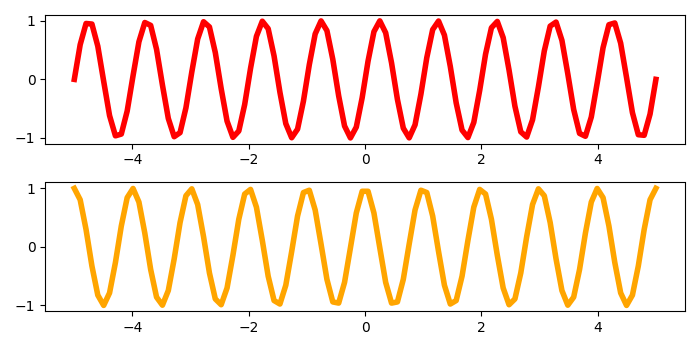
- 创建 "t" 个数据点,在轴 ax1 和 ax2 上绘制正弦和余弦曲线。
- 要显示该图,请使用 show() 方法。
示例
import matplotlib.pyplot as plt
import numpy as np

# 设置图大小
plt.rcParams["figure.figsize"] = [7.00, 3.50]
plt.rcParams["figure.autolayout"] = True

# 绘图图形
fig = plt.figure()

# 添加轴
ax1 = fig.add_subplot(2, 1, 1)
ax2 = fig.add_subplot(2, 1, 2, sharex=ax1)

# 创建数据点
t = np.linspace(-5, 5, 100)

# 在 ax1 和 ax2 上绘制正弦和余弦曲线
ax1.plot(t, np.sin(2 * np.pi * t), color="red", lw=4)
ax2.plot(t, np.cos(2 * np.pi * t), color="orange", lw=4)

plt.show()
输出
它负责产生以下输出