如何旋转 Matplotlib 注释以匹配一条线?
matplotlibpythondata visualization
要旋转 matplotlib 注释以匹配一条线,我们可以采取以下步骤−
- 使用 figure() 方法创建新图形或激活现有图形。
- 使用 add_subplot() 方法将 '~.axes.Axes' 作为子图排列的一部分添加到图形中。
- 初始化变量 m(斜率)和 c(截距)。
- 使用 numpy 创建 x 和 y 数据点。
- 计算 theta 以进行文本旋转。
- 使用 x 和 y 的 plot() 方法绘制线条。
- 使用 text() 将文本放置在线上方法。
- 要显示图形,请使用 show() 方法。
示例
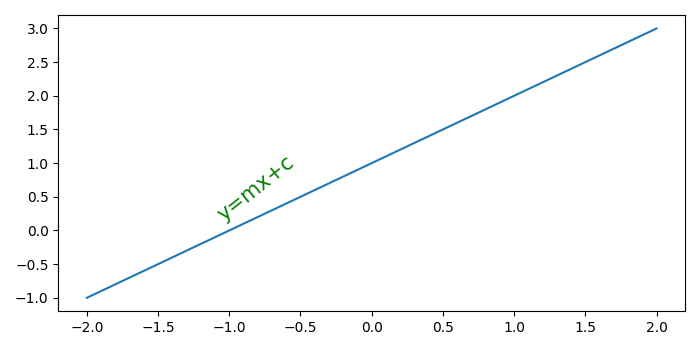
import numpy as np
from matplotlib import pyplot as plt
plt.rcParams["figure.figsize"] = [7.00, 3.50]
plt.rcParams["figure.autolayout"] = True
fig = plt.figure()
ax = fig.add_subplot()
m = 1
c = 1
x = np.linspace(-2, 2, 10)
y = m*x + c
theta = np.arctan(m)
line, = ax.plot(x, y)
ax.text(x=x[2], y=y[2]+.25, s="y=mx+c", rotation=180.0*(1-theta), fontsize=15, color='green')
plt.show()
输出