如何在 Matplotlib 中将表情符号绘制为条形图的标签?
matplotlibpythondata visualization
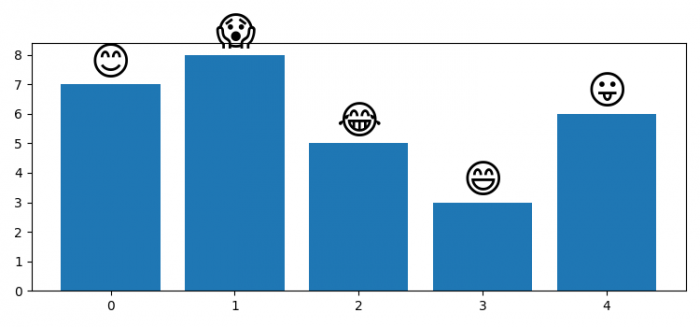
我们可以使用 annotate() 将表情符号放置在条形图的顶部。
步骤
- 设置图形大小并调整子图之间和周围的填充。
- 制作包含表情符号的频率和标签列表。
- 使用 figure() 方法创建新图形或激活现有图形。
- 使用 bar() 方法绘制条形图。
- 使用 annotate() 方法将表情符号作为标签放置
- 要显示图形,请使用 show() 方法。
示例
import numpy as np
from matplotlib import pyplot as plt
plt.rcParams["figure.figsize"] = [7.50, 3.50]
plt.rcParams["figure.autolayout"] = True
freqs = [7, 8, 5, 3, 6]
labels = ['😊', '😲', '😂', '😃', '😛']
plt.figure()
p1 = plt.bar(np.arange(len(labels)), freqs)
for rect1, label in zip(p1, labels):
height = rect1.get_height()
plt.annotate(
label,
(rect1.get_x() + rect1.get_width()/2, height+.05),
ha="center",
va="bottom",
fontsize=30
)
plt.show()
输出