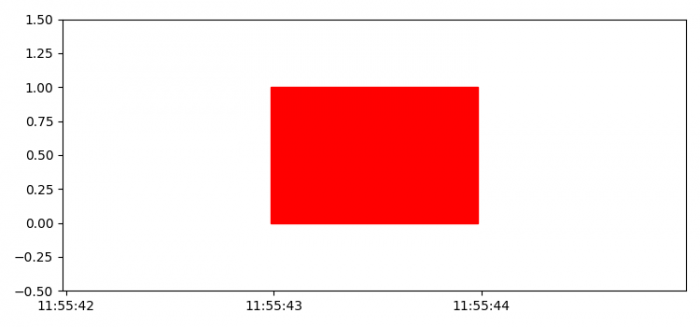
如何使用 Matplotlib 在日期时间轴上绘制矩形?
matplotlibpythondata visualization
要使用 matplotlib 在日期时间轴上绘制矩形,我们可以采取以下步骤 −
- 设置图形大小并调整子图之间和周围的填充。
- 创建新图形或激活现有图形。
- 使用 add_subplot() 方法将 '~.axes.Axes' 作为子图排列的一部分添加到图形中。
- 要定义矩形,请使用日期时间和 matplotlib 的日期找到锚点。
- 将 '~.Patch' 添加到轴'使用 add_patch() 方法。
- 设置主轴定位器和格式化程序。
- 限制 x 和 y 轴比例。
- 要显示图形,请使用 show() 方法。
示例
from datetime import datetime, timedelta
from matplotlib.patches import Rectangle

import matplotlib.pyplot as plt
import matplotlib.dates as mdates

plt.rcParams["figure.figsize"] = [7.50, 3.50]
plt.rcParams["figure.autolayout"] = True

fig = plt.figure()

ax = fig.add_subplot(111)

startTime = datetime.now()
endTime = startTime + timedelta(seconds=1)
start = mdates.date2num(startTime)
end = mdates.date2num(endTime)

width = end – start
rect = Rectangle((start, 0), width, 1, color='red')
ax.add_patch(rect)

locator = mdates.AutoDateLocator(minticks=3)
formatter = mdates.AutoDateFormatter(locator)

ax.xaxis.set_major_locator(locator)
ax.xaxis.set_major_formatter(formatter)

plt.xlim([start - width, end + width])
plt.ylim([-.5, 1.5])

plt.show()
输出


