如何使用 Matplotlib 绘制半黑半白的圆圈?
matplotlibpythondata visualization
要使用 Matplotlib 绘制半黑半白的圆圈,我们可以采取以下步骤 −
- 设置图形大小并调整子图之间和周围的填充。
- 创建一个图形和一组子图。
- 初始化 theta1 和 theta2 以从 theta1 到 theta2 绘制边,反之亦然。
- 在当前轴上添加楔形实例。
- 通过更改轴限制设置相等缩放。
- 设置 x 和 y 比例。
- 要显示图形,请使用 show() 方法。
示例
import matplotlib.pyplot as plt
from matplotlib.patches import Wedge
plt.rcParams["figure.figsize"] = [7.50, 3.50]
plt.rcParams["figure.autolayout"] = True
fig, ax = plt.subplots()
theta1, theta2 = 0, 0 + 180
radius = 2
center = (0, 0)
w1 = Wedge(center, radius, theta1, theta2, fc='black', edgecolor='black')
w2 = Wedge(center, radius, theta2, theta1, fc='white', edgecolor='black')
for wedge in [w1, w2]:
ax.add_artist(wedge)
ax.axis('equal')
ax.set_xlim(-5, 5)
ax.set_ylim(-5, 5)
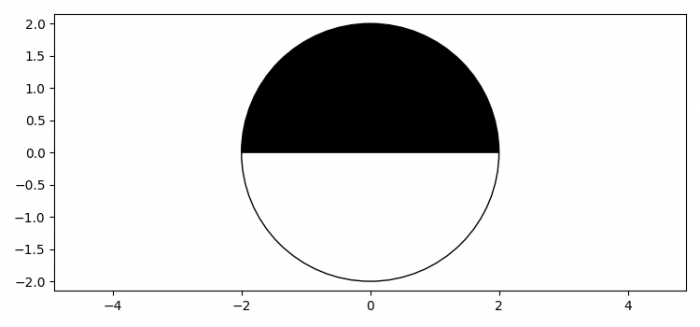
plt.show()
输出