如何在 Matplotlib (Python) 中标记一条线?
matplotlibpythondata visualization
要在 matplotlib 中标记一条线,我们可以在 plot() 方法的参数中使用 label,
步骤
- 设置图形大小并调整子图之间和周围的填充。
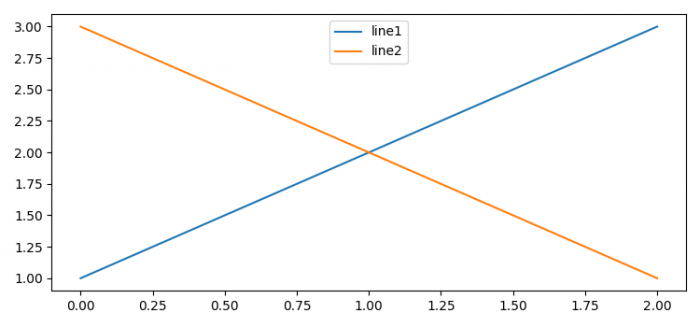
- 使用 plot() 方法用 label="line1" 绘图。
- 使用 plot() 方法用 label="line2" 绘图。
- 要在图形上放置图例,请使用 legend() 方法。
- 要显示图形,请使用 show() 方法。
示例
from matplotlib import pyplot as plt
plt.rcParams["figure.figsize"] = [7.50, 3.50]
plt.rcParams["figure.autolayout"] = True
line1, = plt.plot([1, 2, 3], label="line1")
line2, = plt.plot([3, 2, 1], label="line2")
leg = plt.legend(loc='upper center')
plt.show()
输出