如何使用 Matplotlib 处理渐近线/不连续性?
matplotlibpythondata visualization
要使用 matplotlib 处理渐近线/不连续性,我们可以采取以下步骤 −
使用 numpy 创建 x 和 y 数据点。
关闭轴图。
用 x 和 y 数据点绘制线条。
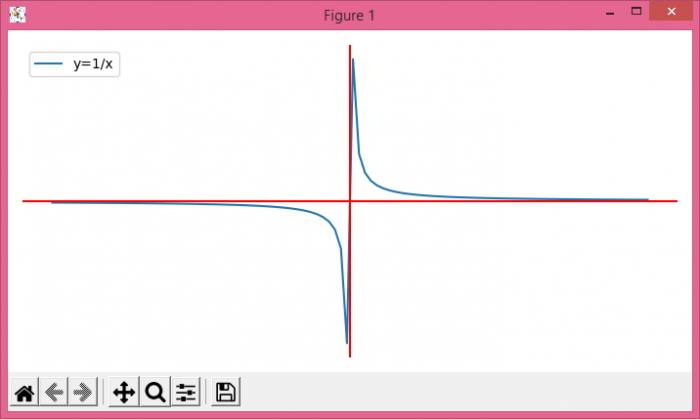
在轴上添加一条水平线,x=0。
在轴上添加一条垂直线,y=0。
为曲线 y=1/x 放置图例。
要显示图形,请使用 show() 方法。
示例
import numpy as np
from matplotlib import pyplot as plt
plt.rcParams["figure.figsize"] = [7.00, 3.50]
plt.rcParams["figure.autolayout"] = True
x = np.linspace(-1, 1, 100)
y = 1 / x
plt.axis('off')
plt.plot(x, y, label='y=1/x')
plt.axhline(y=0, c='red')
plt.axvline(x=0, c='red')
plt.legend(loc='upper left')
plt.show()
输出