如何使用 Matplotlib 创建 100% 堆积面积图?
matplotlibpythondata visualization更新于 2023/10/5 18:54:00
要使用 Matplotlib 创建 100% 堆积面积图,我们可以采取以下步骤 −
设置图形大小并调整子图之间和周围的填充。
创建年份列表。
制作一本字典,列出各年份的人口。
创建一个图形和一组子图。
绘制堆积面积图。
在图形上放置图例,位置为"左上角"。
设置 title、xlabel 和ylabel。
要显示图形,请使用 show() 方法。
示例
import matplotlib.pyplot as plt
plt.rcParams["figure.figsize"] = [7.50, 3.50]
plt.rcParams["figure.autolayout"] = True
year = [1950, 1960, 1970, 1980, 1990, 2000, 2010, 2018]
population_by_continent = {
'africa': [228, 284, 365, 477, 631, 814, 1044, 1275],
'americas': [340, 425, 519, 619, 727, 840, 943, 1006],
'asia': [1394, 1686, 2120, 2625, 3202, 3714, 4169, 4560],
'europe': [220, 253, 276, 295, 310, 303, 294, 293],
'oceania': [12, 15, 19, 22, 26, 31, 36, 39],
}
fig, ax = plt.subplots()
ax.stackplot(year, population_by_continent.values(), labels=population_by_continent.keys())
ax.legend(loc='upper left')
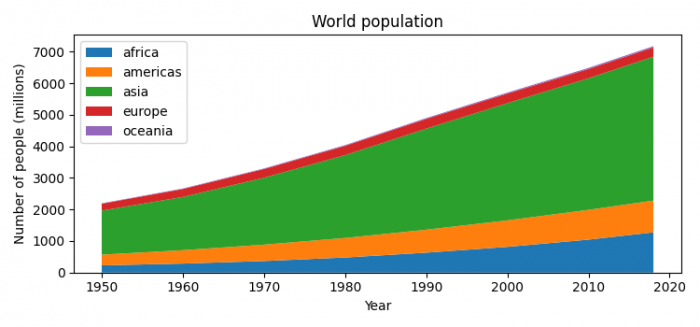
ax.set_title('World population')
ax.set_xlabel('Year')
ax.set_ylabel('Number of people (millions)')
plt.show()
输出