如何在 Matplotlib 中为颜色条设置动画?
matplotlibpythondata visualization
要在 matplotlib 中为颜色条设置动画,我们可以采取以下步骤 −
设置图形大小并调整子图之间和周围的填充。
创建一个新图形或激活一个现有图形。
将 '~.axes.Axes' 添加到图形作为子图布置的一部分。
根据预先存在的轴(即 ax 对象)实例化 Divider 并为指定的单元格返回一个新的轴定位器。
在给定的 *position* 处创建具有相同 height(或width)主轴。
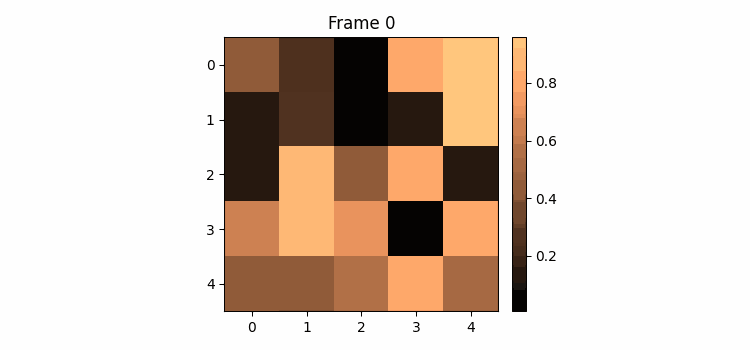
使用 numpy 创建随机数据。
使用 imshow() 方法绘制随机数据。
设置绘图标题。
实例化颜色图列表。
要为颜色条设置动画,请使用 animate() 方法。
要显示图形,请使用 show() 方法。
示例
import numpy as np
import matplotlib.pyplot as plt
import matplotlib.animation as animation
from mpl_toolkits.axes_grid1 import make_axes_locatable

plt.rcParams["figure.figsize"] = [7.50, 3.50]
plt.rcParams["figure.autolayout"] = True

fig = plt.figure()

ax = fig.add_subplot(111)
div = make_axes_locatable(ax)
cax = div.append_axes('right', '5%', '5%')
data = np.random.rand(5, 5)
im = ax.imshow(data)
cb = fig.colorbar(im, cax=cax)
tx = ax.set_title('Frame 0')
cmap = ["copper", 'RdBu_r', 'Oranges', 'cividis', 'hot', 'plasma']

def animate(i):
   cax.cla()
   data = np.random.rand(5, 5)
   im = ax.imshow(data, cmap=cmap[i%len(cmap)])
   fig.colorbar(im, cax=cax)
   tx.set_text('Frame {0}'.format(i))
ani = animation.FuncAnimation(fig, animate, frames=10)

plt.show()
输出