如何在 Matplotlib 中为文本添加动画?
matplotlibpythondata visualization
要在 matplotlib 中为文本添加动画,我们可以采取以下步骤 −
- 从 matplotlib 导入"animation"包。
- 设置图形大小并调整子图之间和周围的填充。
- 创建新图形或激活现有图形。
- 将"ax"添加到图形作为子图布置的一部分。
- 初始化变量"text"保存字符串。
- 在 x=0.20 和 y=0.50 处的轴上添加文本。
- 制作颜色列表。
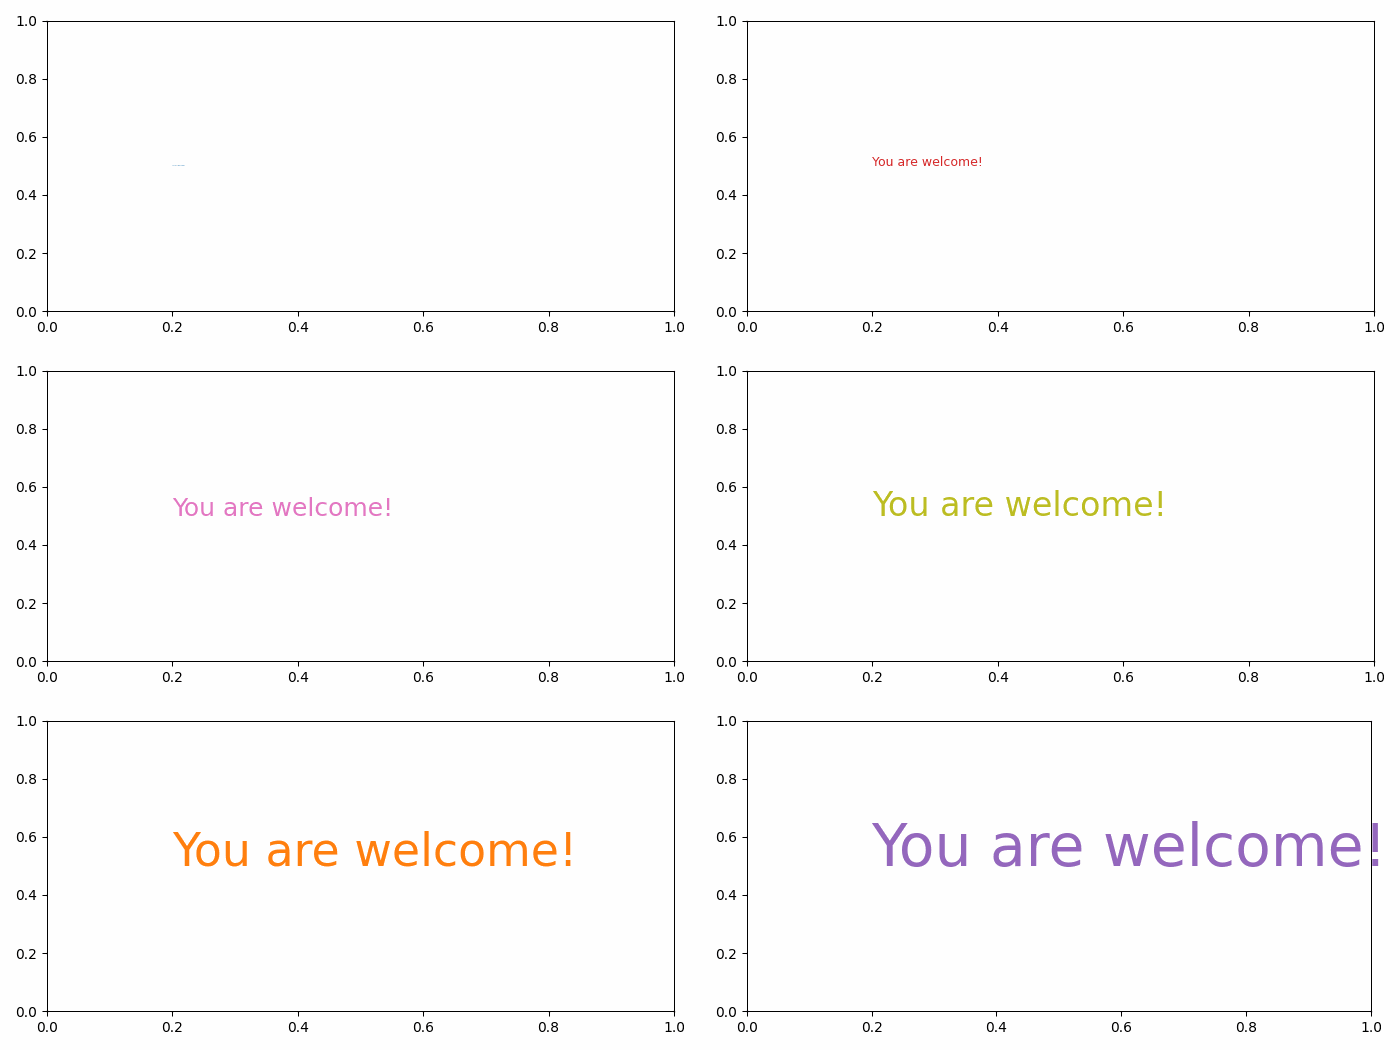
- 通过反复调用函数 *animate* 制作动画,其中文本大小增加并且颜色改变。
- 要显示图形,请使用 show() 方法。
示例
from matplotlib import animation
import matplotlib.pyplot as plt

plt.rcParams["figure.figsize"] = [7.00, 3.50]
plt.rcParams["figure.autolayout"] = True

fig = plt.figure()
ax = fig.add_subplot(111)
text = 'You are welcome!'
txt = ax.text(.20, .5, text, fontsize=15)

colors = ['#1f77b4', '#ff7f0e', '#2ca02c', '#d62728', '#9467bd', '#8c564b', '#e377c2',    '#7f7f7f', '#bcbd22', '#17becf']


def animate(num):
   txt.set_fontsize(num * 2 + num)
   txt.set_color(colors[num % len(colors)])
   return txt,

anim = animation.FuncAnimation(fig, animate, frames=len(text) - 1, blit=True)

plt.show()
输出
它将产生以下输出


