如何以编程方式选择 Matplotlib 中的特定子图?
matplotlibpythondata visualization
要在 matplotlib 中选择特定子图,我们可以采取以下步骤 −
设置图形大小并调整子图之间和周围的填充。
使用 figure() 方法创建新图形或激活现有图形。
在范围内迭代,即要放置的子图数量。
在循环本身中,使用 add_subplot() 方法将 '~.axes.Axes' 作为子图排列的一部分添加到图形中。
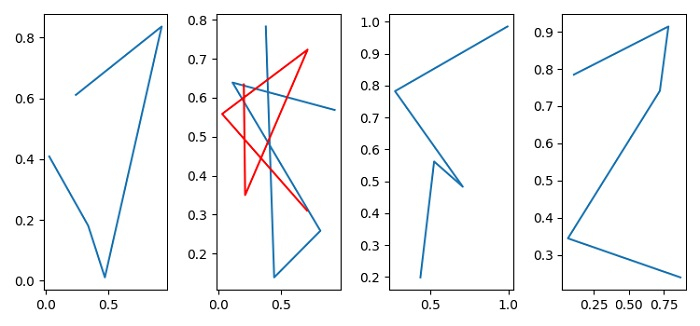
现在,选择一条红色的轴绘图线。
要显示图,使用show()方法。
示例
import numpy as np
import matplotlib.pyplot as plt

plt.rcParams["figure.figsize"] = [7.50, 3.50]
plt.rcParams["figure.autolayout"] = True

fig = plt.figure()

for index in [1, 2, 3, 4]:
   ax = fig.add_subplot(1, 4, index)
   ax.plot(np.random.rand(5), np.random.rand(5))

ax = fig.add_subplot(1, 4, 2)
ax.plot(np.random.rand(5), np.random.rand(5), color='red')

plt.show()
输出