在 Matplotlib 中绘制子图周围的边框
matplotlibpythondata visualization
要在 matplotlib 中绘制子图周围的边框,我们可以在子图上使用矩形补丁。
步骤
设置图形大小并调整子图之间和周围的填充。
使用 subplot(121) 向当前图形添加子图。
获取子图轴。
添加通过锚点 *xy* 及其 *width* 和 *height* 定义的矩形。
根据轴向当前子图添加矩形补丁(步骤 4)。
设置艺术家是否使用剪辑。
使用 subplot(122) 向当前图形添加子图。
设置当前子图的标题。
要显示图形,请使用 show() 方法。
示例
from matplotlib import pyplot as plt
plt.rcParams["figure.figsize"] = [7.50, 3.50]
plt.rcParams["figure.autolayout"] = True
sub = plt.subplot(121)
ax = sub.axis()
rec = plt.Rectangle((ax[0] - 0.7, ax[2] - 0.2), (ax[1] - ax[0]) + 1, (ax[3] - ax[2]) + 0.4, fill=False, lw=2, linestyle="dotted")
rec = sub.add_patch(rec)
rec.set_clip_on(False)
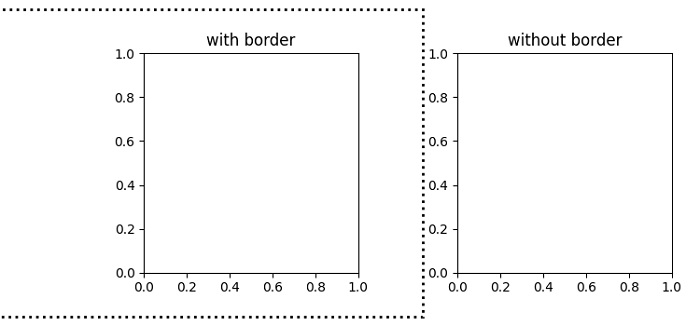
plt.title("with border")
sub = plt.subplot(122)
plt.title("without border")
plt.show()
输出