Magento - 分析
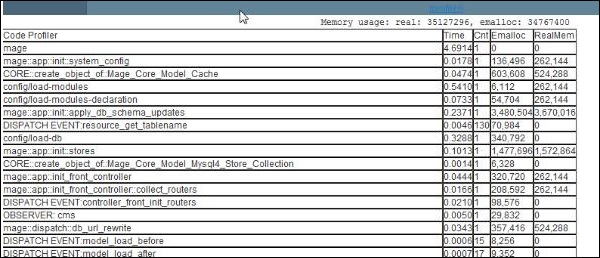
名为 Profiler 的功能在 Magento 开发中起着重要作用,可用于调试。它指定导致页面加载缓慢的代码块。Magento 分析器报告执行代码块所花费的时间、执行代码块的次数以及在呈现 Magento 网页时使用的内存。
要启用 Profiler,请按照以下步骤 −
步骤 1 − 登录到您的 Magento 管理面板。
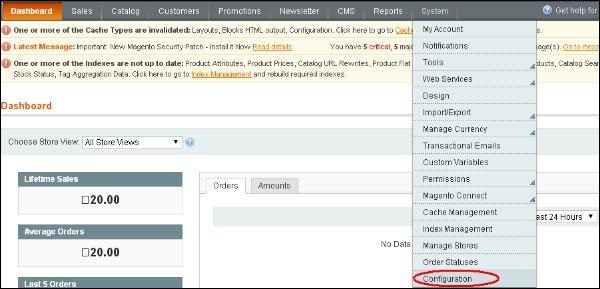
步骤 2 −转到系统菜单并单击配置选项。
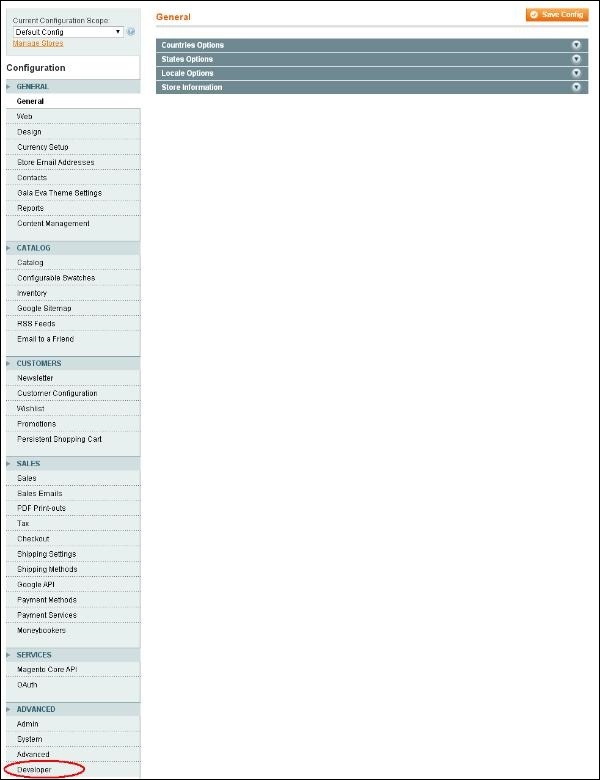
步骤 3 − 在导航栏左侧,转到高级部分并单击开发人员选项。
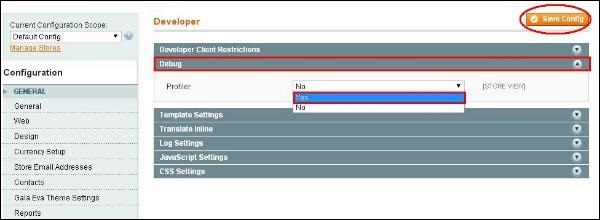
步骤 4 −展开 Debug 面板,将分析器设置为 Yes 以启用它,然后单击 Save Config 按钮。
步骤 5 − 此时分析器已启用,但您需要告诉分析器要使用哪个配置文件。因此,转到 Magento 安装的根 index.php 文件,查找行 #Varien_Profiler::enable(); 并取消注释,即删除井号。
步骤 6 −现在转到您的任意页面,您应该会在页面的页脚区域看到输出,如以下屏幕所示。