XGBoost - Python 实现
在本章中,我们将使用 XGBoost Python 模块在泰坦尼克号数据上训练 XGBoost 模型。我们生成此模型的主要目标是通过考虑年龄、性别和舱位等变量来预测乘客是否幸存。此外,我们还将修改模型的超参数。
先决条件
在使用 Python 构建 XGBoost 模型之前,必须满足以下条件 −
Python 环境:需要 Python 3.6 或更高版本。您可以使用 PyCharm、Visual Studio Code 或 Jupyter Notebook 等库来编写和运行 Python 代码。
库:应安装数据操作、可视化和机器学习所需的 Python 库。我们将在模型中使用的库是 scikit-learn、xgboost、matplotlib、pandas、numpy 和 seaborn。
数据集:具有特征和二分类或多类分类的因变量的有效数据集。数据集需要采用 pandas 可以快速加载的格式,例如 CSV。
拥有必要的工具、库、数据集和基本知识将帮助您使用 Python 构建 XGBoost 模型。
XGBoost 实现
以下是您需要遵循的步骤 −
步骤 1:安装所需的库
我们需要一些库来实现此实现,因此如果您尚未安装,请借助以下命令安装它们 −
# 安装必要的库
pip install matplotlib
pip install numpy
pip install pandas
pip install scikit-learn
pip install seaborn
pip install xgboost
步骤 2:导入所需的库
现在您必须导入库 −
# 以下是导入
import matplotlib.pyplot as plt
import numpy as np
import pandas as pd
import seaborn as sns
import xgboost as xgb
from sklearn.metrics import accuracy_score, confusion_matrix, ConfusionMatrixDisplay
from sklearn.model_selection import GridSearchCV, train_test_split
步骤 3:加载泰坦尼克号数据集
本课程将使用可从 Kaggle 和其他网站下载的泰坦尼克号数据集。因此,请下载 titanic.csv 以获取泰坦尼克号数据集。您需要将 CSV 文件上传到 Jupyter Notebook。此时将数据读入 pandas DataFrame −
# 加载数据集
titanic_df = pd.read_csv('/Python/Datasets/titanic.csv')

# 显示数据集的前几行
print(titanic_df.head())
输出
这将产生以下结果 −
   PassengerId  Survived  Pclass  \
0            1         0       3
1            2         1       1
2            3         1       3
3            4         1       1
4            5         0       3

                                                Name     Gender   Age  SibSp  \
0                            Braund, Mr. Owen Harris    male  22.0      1
1  Cumings, Mrs. John Bradley Florence Briggs Th...  female  38.0      1
2                             Heikkinen, Miss. Laina  female  26.0      0
3       Futrelle, Mrs. Jacques Heath (Lily May Peel)  female  35.0      1
4                           Allen, Mr. William Henry    male  35.0      0

   Parch            Ticket     Fare Cabin Embarked
0      0         A/5 21171   7.2500   NaN        S
1      0          PC 17599  71.2833   C85        C
2      0  STON/O2. 3101282   7.9250   NaN        S
3      0            113803  53.1000  C123        S
4      0            373450   8.0500   NaN        S
步骤 4:数据预处理
在训练模型之前,我们需要对数据进行预处理。此步骤包括处理缺失数据、编码分类变量和选择特征。查找任何缺失的值 −
# 检查缺失值
print(titanic_df.isnull().sum())
输出
这将生成以下结果 −
PassengerId      0
Survived         0
Pclass           0
Name             0
Gender              0
Age            177
SibSp            0
Parch            0
Ticket           0
Fare             0
Cabin          687
Embarked         2
dtype: int64
填写空白或删除它们 −
# 删除有缺失值的行
titanic_df = titanic_df.dropna()
现在我们将选择必要的特征并编码分类变量:
# 选择特征和目标变量
X = titanic_df[['Pclass', 'Gender', 'Age', 'SibSp', 'Parch', 'Fare']]
y = titanic_df['Survived']

# 编码分类变量"性别"
X.loc[:, 'Gender'] = X['Gender'].map({'male': 0, 'female': 1})
步骤 5:训练和评估模型
将数据分为训练集和测试集后,我们现在将训练模型并评估其有效性。这里将数据拆分如下 −
# 将数据拆分为训练集和测试集
X_train, X_test, y_train, y_test = train_test_split(X, y, test_size=0.3, random_state=0)
接下来,我们需要将数据转换为 XGBoost 模型的 DMatrix 格式 −
# 将训练集和测试集中的"性别"列转换为数字
X_train['Gender'] = X_train['Gender'].map({'male': 0, 'female': 1})
X_test['Gender'] = X_test['Gender'].map({'male': 0, 'female': 1})

# 确保没有缺失值,数据类型为数字
X_train = X_train.astype(float)
X_test = X_test.astype(float)

# 现在转换为 DMatrix 格式
dmatrix_train = xgb.DMatrix(data=X_train, label=y_train)
dmatrix_test = xgb.DMatrix(data=X_test, label=y_test)
然后我们将训练模型 −
# 设定学习目标
learning_objective = {'objective': 'binary:logistic'}

# 训练模型
model = xgb.train(params=learning_objective, dtrain=dmatrix_train)
之后我们必须评估模型 −
# 进行预测
test_predictions = model.predict(dmatrix_test)
round_test_predictions = [round(p) for p in test_predictions]

# 计算准确度
accuracy = accuracy_score(y_test, round_test_predictions)
print(f'Accuracy: {accuracy:.2f}')
输出
这将创建以下结果 −
准确度:0.80
步骤 6:超参数调整
我们现在将使用 GridSearchCV 实现超参数调整,以找到我们的 XGBoost 模型的理想参数。因此设置参数网格 −
# 定义参数网格
params_grid = {
    'learning_rate': [0.01, 0.05],
    'gamma': [0, 0.01],
    'max_depth': [6, 7],
    'min_child_weight': [1, 2, 3],
    'subsample': [0.6, 0.7],
    'n_estimators': [400, 600, 800],
    'colsample_bytree': [0.7, 0.8],
}
定义并设置 XGBoost 分类器和 GridSearchCV −
# 定义 XGBoost 分类器
classifier = xgb.XGBClassifier()

# 设置 GridSearchCV
grid_classifier = GridSearchCV(classifier, params_grid,scoring='accuracy', cv=5)
grid_classifier.fit(X_train, y_train)
确定最合适的参数后,我们将评估模型:
# 获取最佳参数
best_parameters = grid_classifier.best_params_
print("最佳参数:", best_parameters)

# 使用最佳模型进行预测
grid_test_preds = grid_classifier.predict(X_test)

# 计算准确率
grid_test_accuracy = accuracy_score(y_test, grid_test_preds)
print(f'GridSearchCV Accuracy: {grid_test_accuracy:.2f}')
输出
这将导致以下结果 −
最佳参数:{'colsample_bytree': 0.7, 'gamma': 0, 'learning_rate': 0.01, 'max_depth': 7, 'min_child_weight': 1, 'n_estimators': 600, 'subsample': 0.7}
GridSearchCV Accuracy: 0.78
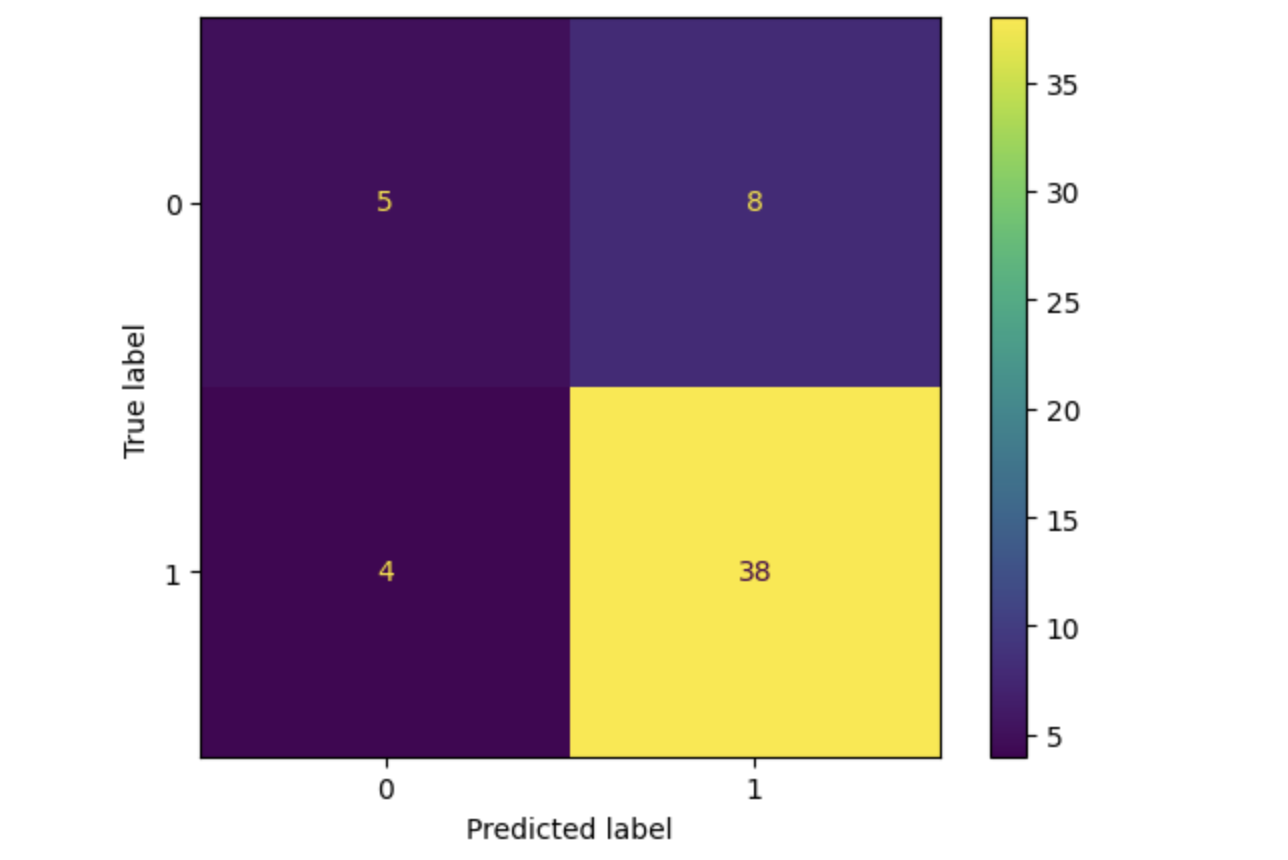
在这里我们将绘制混淆矩阵。
# 绘制混淆矩阵
cm = chaos_matrix(y_test, grid_test_preds)
disp = ConfusionMatrixDisplay(confusion_matrix=cm, display_labels=grid_classifier.classes_)
disp.plot()
plt.show()
输出
这将导致以下结果 −
总结
我们在本章中使用 Titanic 数据集来解释如何实现 XGBoost 模型。因此,为了提高模型的性能,您可以研究替代数据集。


