Excel Power Pivot - DAX 基础知识
DAX (Data Analysis eXpression) 语言是 Power Pivot 的语言。 DAX被Power Pivot用于数据建模,方便您用于自助BI。 DAX基于数据表和数据表中的列。 请注意,它不像 Excel 中的公式和函数那样基于表格中的单个单元格。
您将学习数据模型中存在的两个简单计算 − 本章中的计算列和计算字段。
计算列
计算列是数据模型中由计算定义并扩展数据表内容的列。 它可以可视化为由公式定义的 Excel 表格中的新列。
使用计算列扩展数据模型
假设您在数据表中有按区域划分的产品销售数据,并且在数据模型中有一个产品目录。
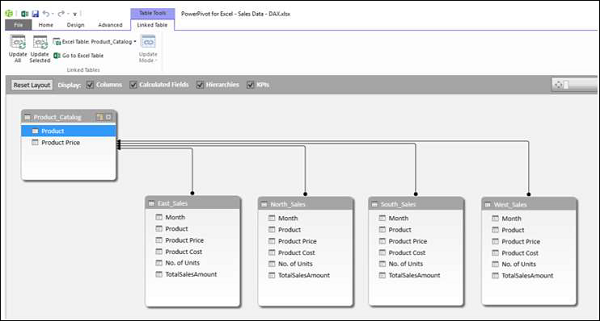
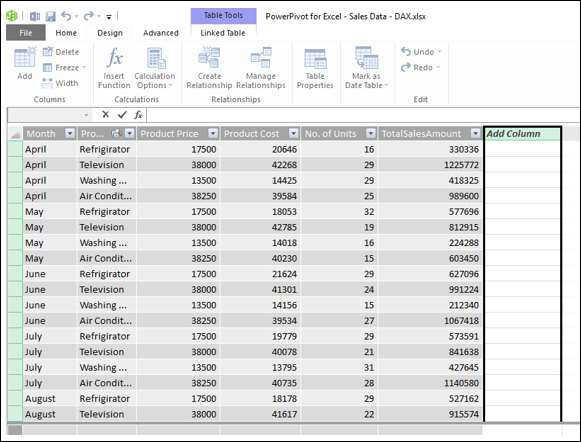
使用此数据创建 Power PivotTable。
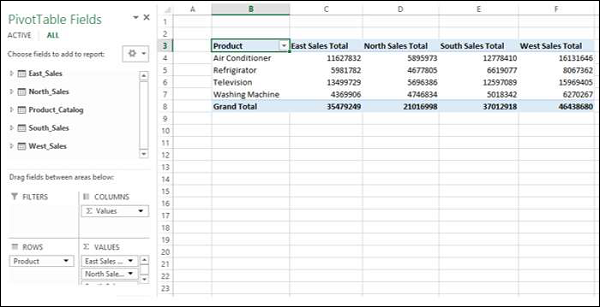
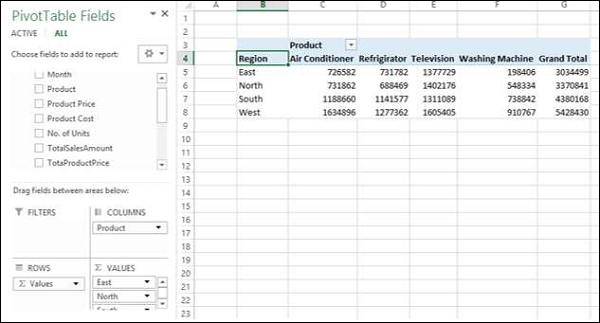
如您所见,Power PivotTable 汇总了所有地区的销售数据。 假设您想知道每种产品的毛利润。 您知道每种产品的价格、销售成本和销售单位数量。
但是,如果需要计算毛利,则需要在每个地区的数据表中多出两列− 总产品价格和毛利润。 这是因为,数据透视表需要数据表中的列来汇总结果。
如您所知,总产品价格是产品价格 * 单位数,毛利是总金额 - 总产品价格。
您需要使用 DAX 表达式添加计算列,如下所示 −
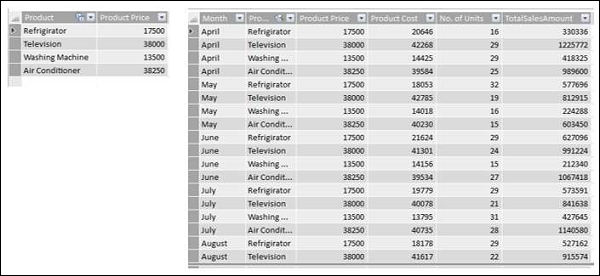
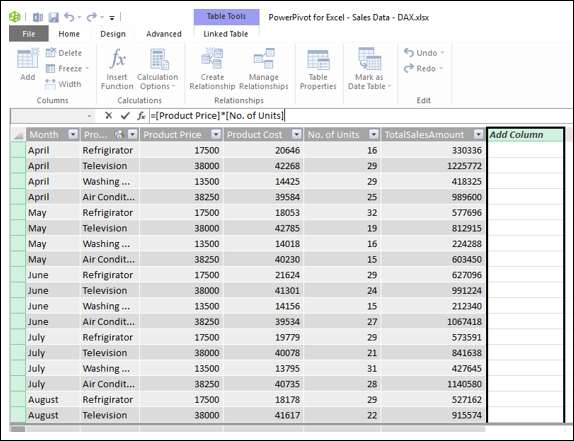
单击 Power Pivot 窗口数据视图中的 East_Sales 选项卡以查看 East_Sales 数据表。
单击功能区上的"设计"选项卡。
点击添加。
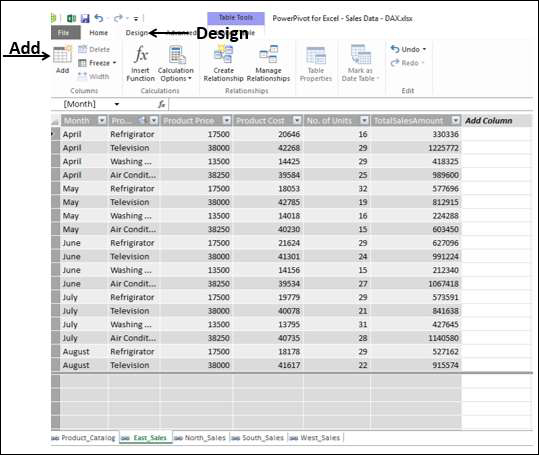
右侧带有标题的列 − 添加列突出显示。
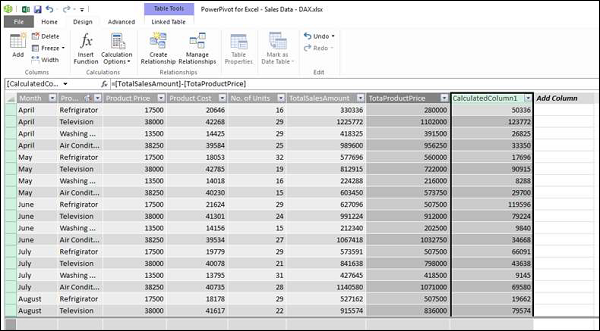
Type = [Product Price] * [No. of Units],然后按 Enter。
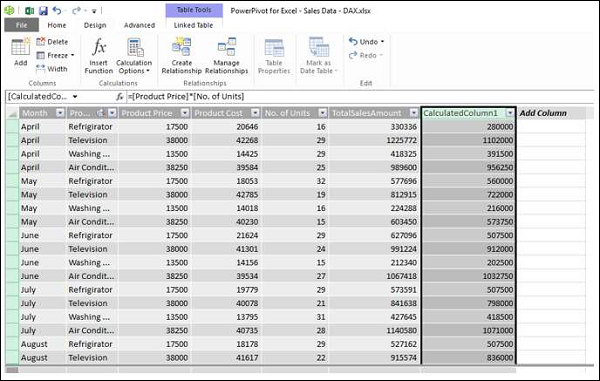
标题为 CalculatedColumn1 的新列已插入,其中包含根据您输入的公式计算出的值。
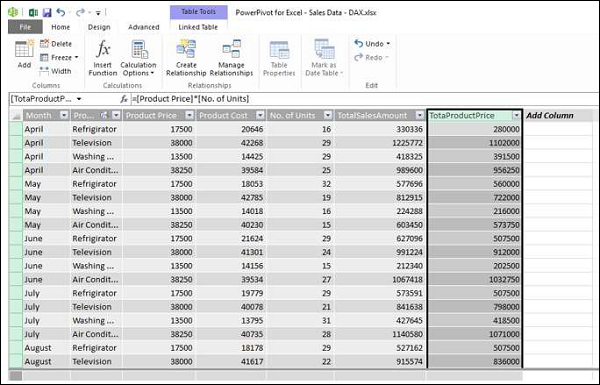
双击新计算列的标题。
将标头重命名为 TotalProductPrice。
为 Gross Profit 添加一个计算列,如下所示 −
单击功能区上的"设计"选项卡。
点击添加。
右侧带有标题的列 − 添加列突出显示。
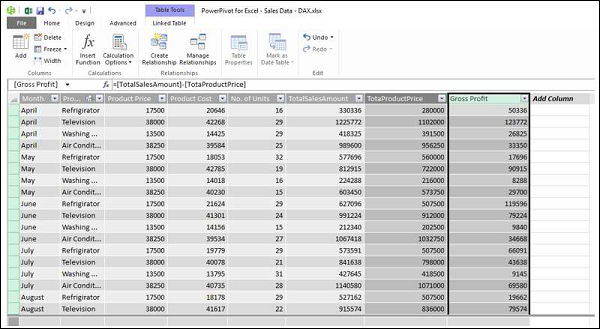
Type = [TotalSalesAmount] − [TotaProductPrice] 在公式栏中。
按回车键。
标题为 CalculatedColumn1 的新列已插入,其中包含根据您输入的公式计算出的值。
双击新计算列的标题。
将标题重命名为毛利。
以类似的方式在 North_Sales 数据表中添加计算列。 综合所有步骤,进行如下操作 −
单击功能区上的"设计"选项卡。
点击添加。 右侧带有标题的列 − 添加列突出显示。
Type = [Product Price] * [No. of Units],然后按 Enter。
标题为 CalculatedColumn1 的新列将插入,其中包含根据您输入的公式计算得出的值。
双击新计算列的标题。
将标头重命名为 TotalProductPrice。
单击功能区上的"设计"选项卡。
点击添加。 右侧带有标题的列 - 添加列突出显示。
Type = [TotalSalesAmount] − [TotaProductPrice] 在公式栏中,然后按 Enter。 将插入标题为 CalculatedColumn1 的新列,其中包含根据您输入的公式计算出的值。
双击新计算列的标题。
将标题重命名为 Gross Profit。
对 South Sales 数据表和 West Sales 数据表重复上述步骤。
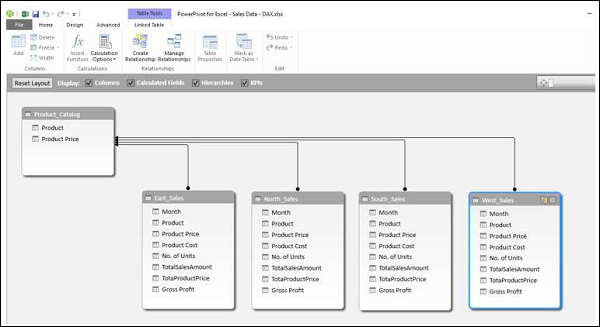
您有必要的列来汇总毛利。 现在,创建 Power PivotTable。
您可以通过 Power Pivot 中的计算列汇总毛利润,这一切都可以通过几个步骤完成,而且不会出现错误。
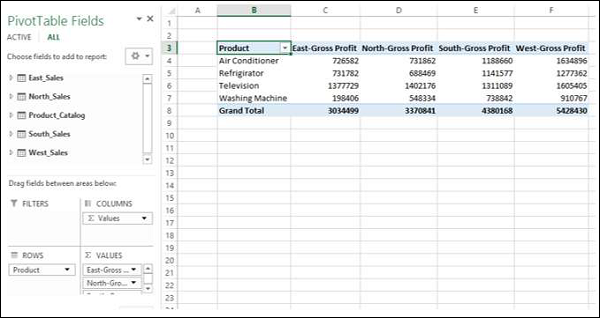
您还可以按区域对产品进行总结,如下所示 −
计算字段
假设您要计算每个区域产品的利润百分比。 您可以通过向数据表添加计算字段来实现。
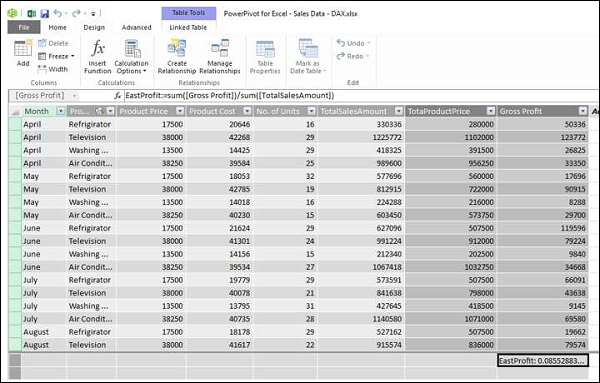
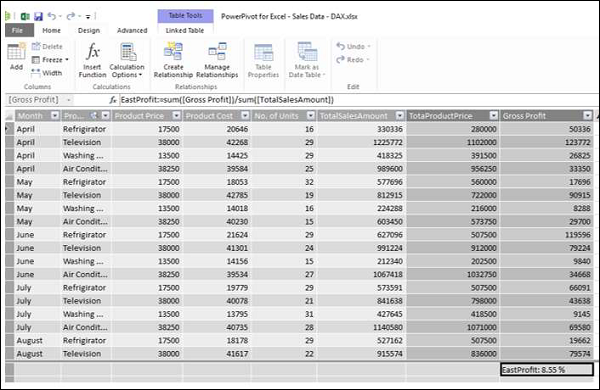
单击 Power Pivot 窗口中 East_Sales 表中的毛利列下方。
在公式栏中输入 EastProfit: = SUM ([Gross Profit]) / sum ([TotalSalesAmount])。
按回车键。
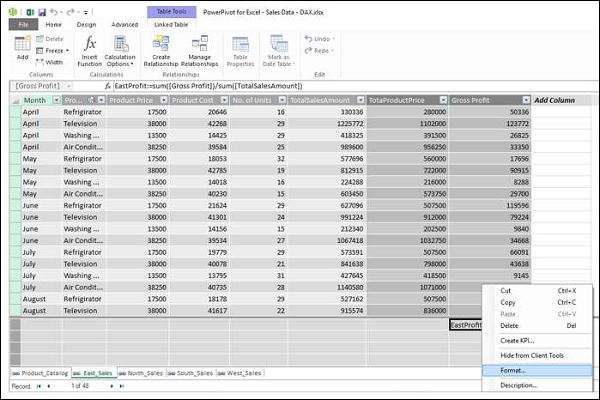
计算字段 EastProfit 插入到 Gross Profit 列下方。
右击计算字段− EastProfit.
从下拉列表中选择格式。
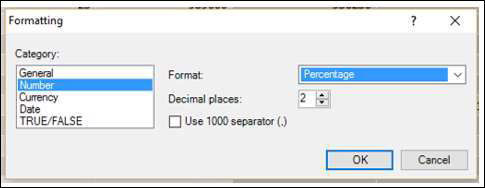
格式对话框出现。
在类别下选择数字。
在"格式"框中,选择"百分比"并单击"确定"。
计算字段 EastProfit 的格式设置为百分比。
重复上述步骤插入以下计算字段 −
North_Sales 数据表中的 NorthProfit。
South_Sales 数据表中的 SouthProfit。
West_Sales 数据表中的 WestProfit。
注意 − 您不能使用给定名称定义多个计算字段。
单击 Power 数据透视表。 您可以看到计算字段出现在表中。
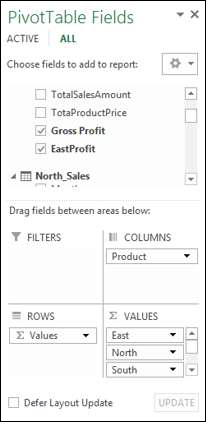
选择字段 − 来自数据透视表字段列表中的表的 EastProfit、NorthProfit、SouthProfit 和 WestProfit。
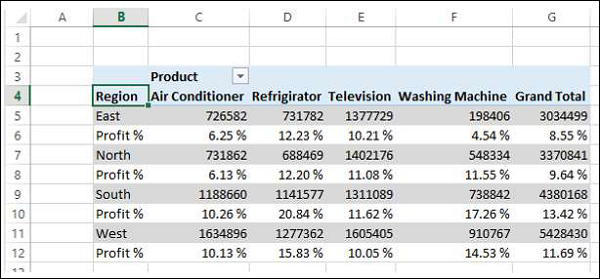
排列字段,使毛利和利润百分比显示在一起。 Power PivotTable 如下所示 −
注意 − 计算字段在早期版本的 Excel 中称为度量。


