Excel Power Pivot - 美化报告
您可以使用数据模型中的 Power Pivot 数据为您的数据分析创建美观的报告。
重要的功能是 −
您可以使用数据透视图生成数据的可视化报告。 您可以使用报表布局来构建数据透视表,使其易于阅读。
您可以插入切片器以在报表中过滤数据。
您可以对同一报表中的数据透视图和数据透视表使用通用切片器。
一旦您的最终报告准备就绪,您可以选择隐藏切片器以形成显示。
在本章中,您将了解如何使用 Power Pivot 中可用的选项获取报告。
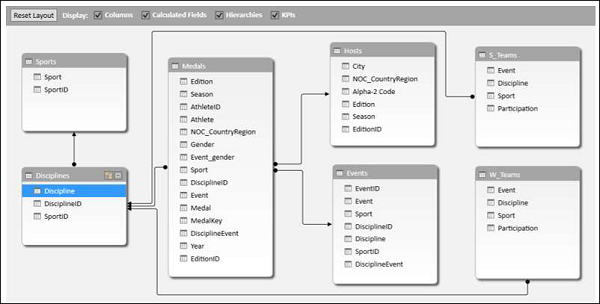
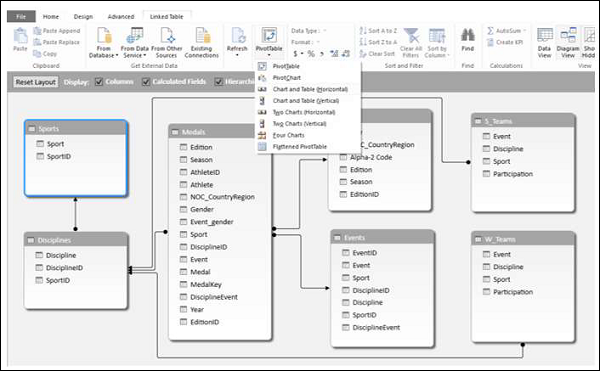
考虑以下数据模型以用于本章中的说明。
基于 Power PivotChart 的报表
创建一个Power PivotChart 如下 −
单击 PowerPivot 窗口中功能区上的主页选项卡。
单击数据透视表。
从下拉列表中选择数据透视图。
在"创建数据透视图"对话框中单击新建工作表。
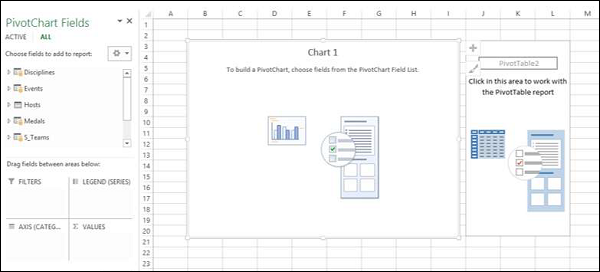
在 Excel 窗口的新工作表中创建了一个空的数据透视图。
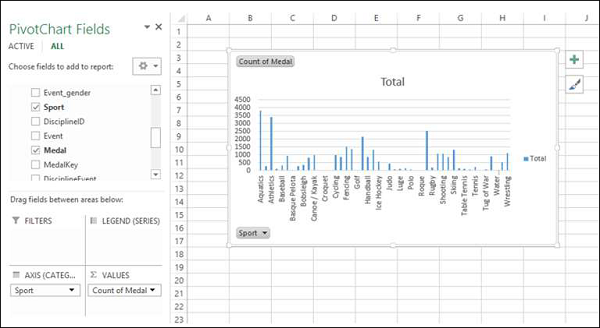
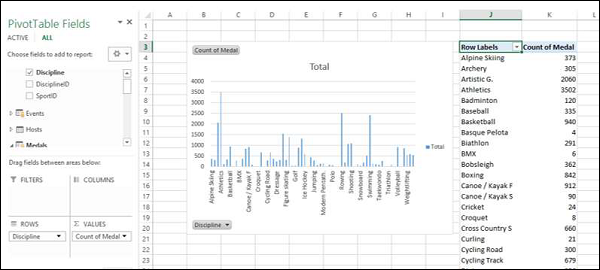
将 Sport 从 Medals 表拖到 Axis 区域。
将 Medal 从奖牌表拖到 ∑ VALUES 区域。
单击功能区上 PIVOTTABLE TOOLS 中的 ANALYZE 选项卡。
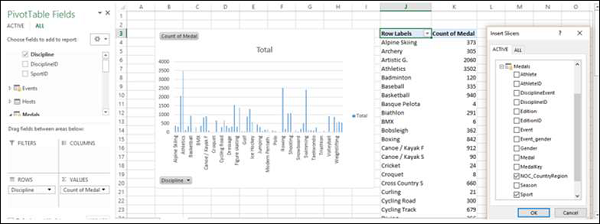
点击过滤器组中的插入切片器。 出现"插入切片器"对话框。
单击 Medals 表中的字段 NOC_CountryRegion。
单击"确定"。
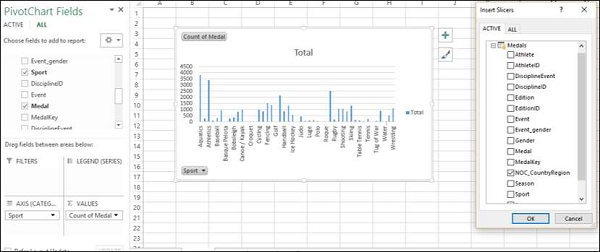
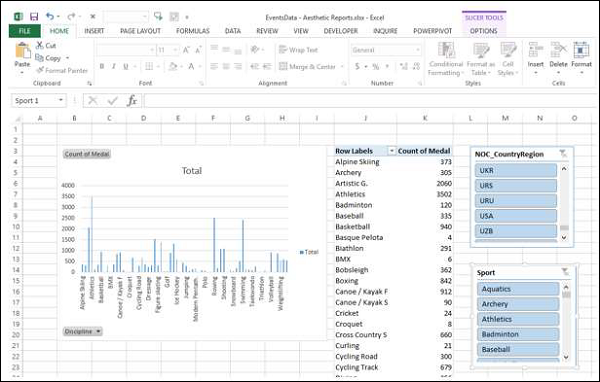
切片器 NOC_CountryRegion 出现。
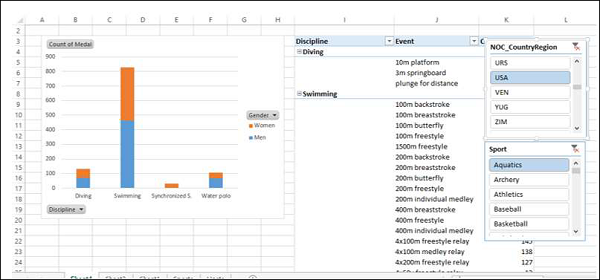
选择 USA
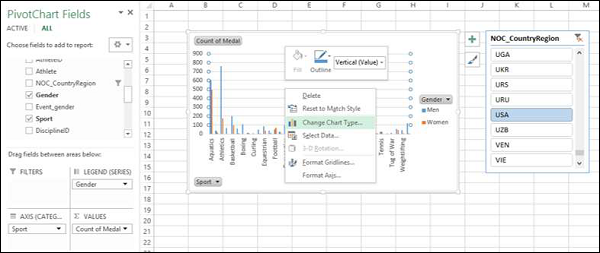
将 Gender 从奖牌表拖到 GENDER 区域。
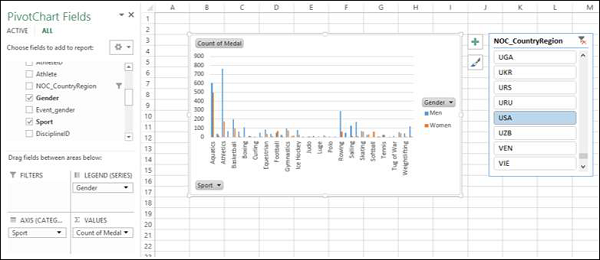
右键单击数据透视图。
从下拉列表中选择更改图表类型。
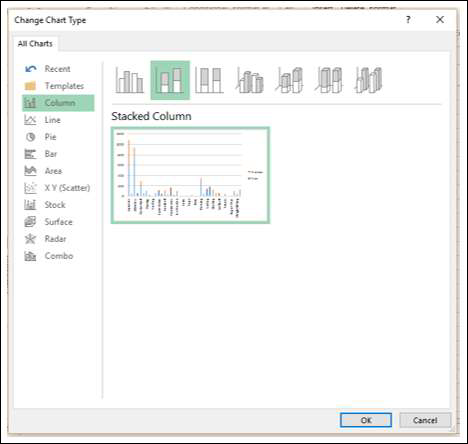
出现"更改图表类型"对话框。
单击堆积柱。
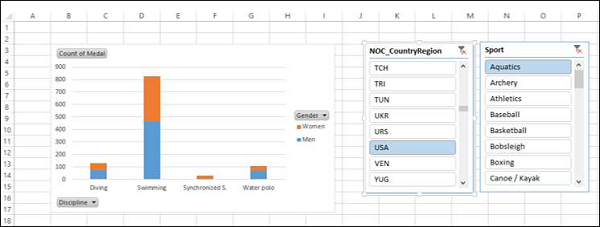
为 Sport 字段插入切片器。
将 Discipline 从 Disciplines 表拖到 AXIS 区域。
从 AXIS 区域中删除字段 Sport。
在切片器中选择 Aquatics - Sport。
报表布局
创建数据透视表如下 −
单击 PowerPivot 窗口中功能区上的主页选项卡。
单击数据透视表。
单击下拉列表中的数据透视表。 出现"创建数据透视表"对话框。
单击"新建工作表",然后单击"确定"。 在新工作表中创建一个空的数据透视表。
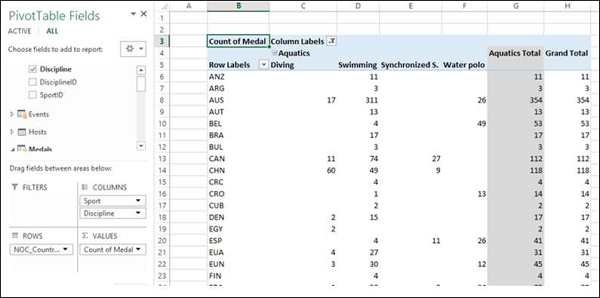
将 NOC_CountryRegion 从 Medals 表拖到 AXIS 区域。
将 Sport 从 Medals 表拖到 COLUMNS 区域。
将 Discipline 从 Disciplines 表拖到 COLUMNS 区域。
将 Medal 拖到 ∑ VALUES 区域。
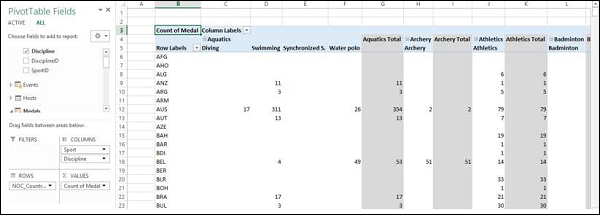
单击列标签旁边的箭头按钮并选择 Aquatics。
单击行标签旁边的箭头按钮。
从下拉列表中选择值过滤器。
从第二个下拉列表中选择大于或等于。
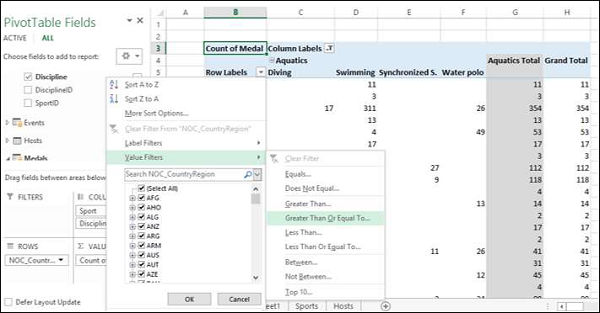
在"值过滤器"对话框中,在"奖牌数大于或等于"旁边的框中键入 80。
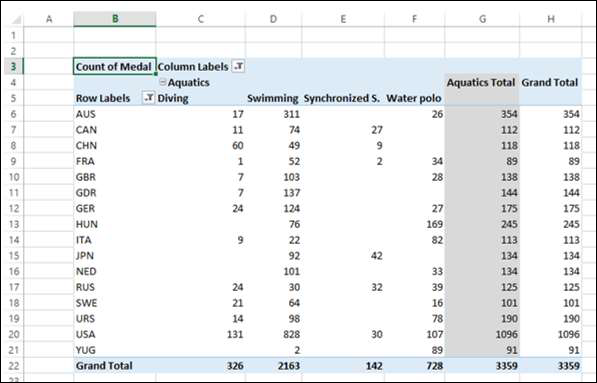
单击功能区上 PIVOTTABLE TOOLS 中的 DESIGN 选项卡。
单击小计。
从下拉列表中选择不显示小计。
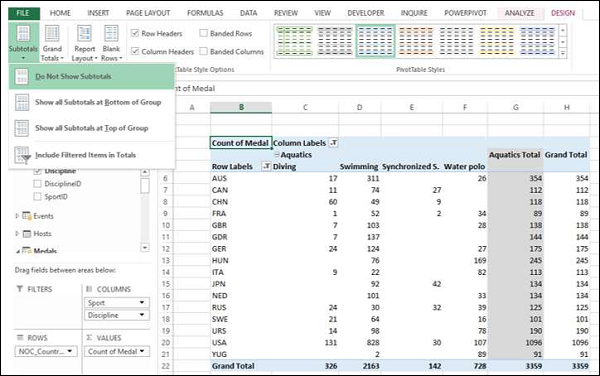
小计列 – 水上运动总计被删除。
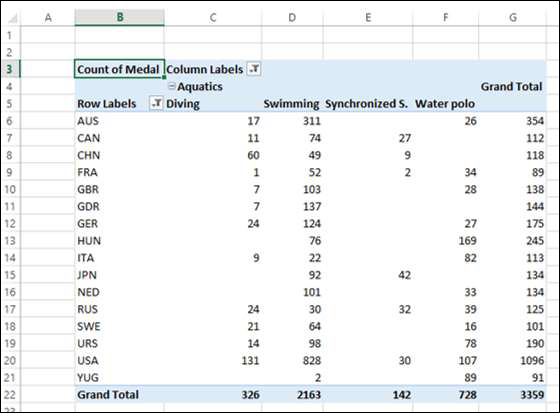
单击报表布局并从下拉列表中选择以大纲形式显示。
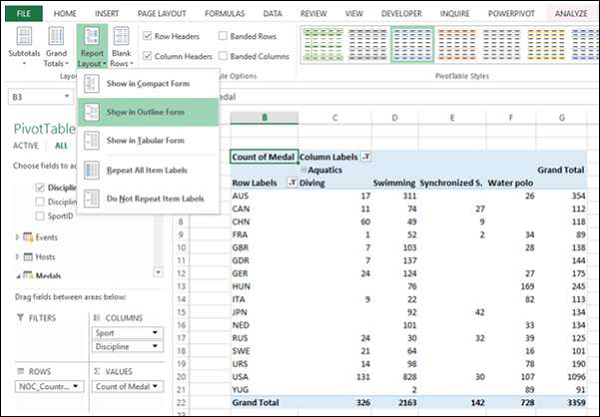
选中 Banded Rows 框。
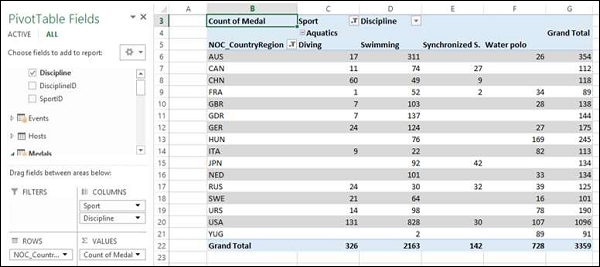
字段名称出现在行标签和列标签的位置,报告看起来不言自明。
使用通用切片器
创建彼此相邻的数据透视图和数据透视表。
单击 PowerPivot 选项卡中功能区上的主页选项卡。
单击数据透视表。
从下拉列表中选择图表和表格(水平)。
出现"创建数据透视图和数据透视表(水平)"对话框。
选择新建工作表并单击确定。 一个空数据透视图和一个空数据透视表出现在新工作表中彼此相邻。
单击数据透视图。
将 Discipline 从 Disciplines 表拖到 AXIS 区域。
将奖牌从奖牌表拖到 ∑ VALUES 区域。
单击数据透视表。
将 Discipline 从 Disciplines 表拖到 ROWS 区域。
将 Medal 从 Medals 拖到 ∑ VALUES 区域。
单击功能区上 PIVOTTABLE TOOLS 中的 ANALYZE 选项卡。
单击"插入切片器"。 出现"插入切片器"对话框。
点击 Medals 表中的 NOC_CountryRegion 和 Sport。
单击"确定"。
出现两个切片器 – NOC_CountryRegion 和 Sport。 排列它们并调整它们的大小以在数据透视表旁边正确对齐。
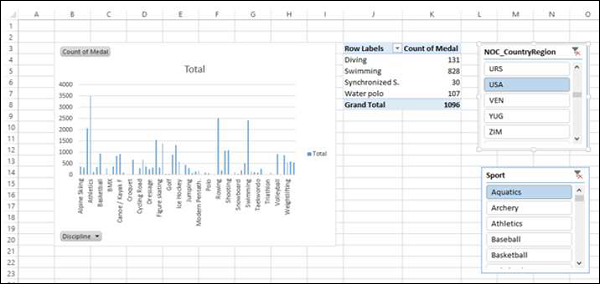
在 NOC_CountryRegion Slicer 中选择 USA。
在 Sport Slicer 中选择 Aquatics。 数据透视表过滤为所选值。
如您所见,数据透视图未经过筛选。 要使用相同的筛选器筛选数据透视图,您无需为数据透视图再次插入切片器。 您可以使用与数据透视表相同的切片器。
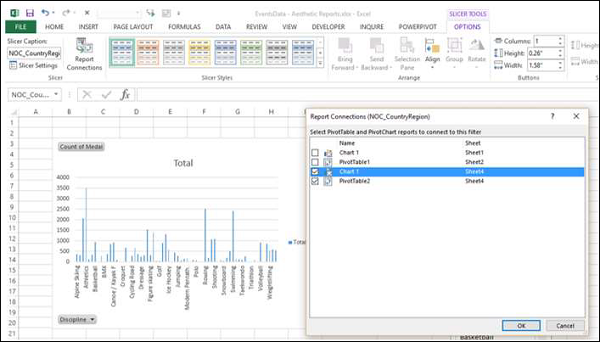
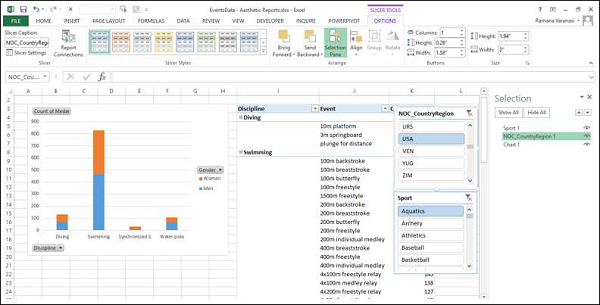
点击 NOC_CountryRegion 切片器。
单击功能区上切片工具中的选项选项卡。
单击切片器组中的报告连接。 NOC_CountryRegion 切片器的 Report Connections 对话框出现。
可以看到对话框中列出了工作簿中的所有数据透视表和数据透视图。
单击与所选数据透视表位于同一工作表中的数据透视图,然后单击"确定"。
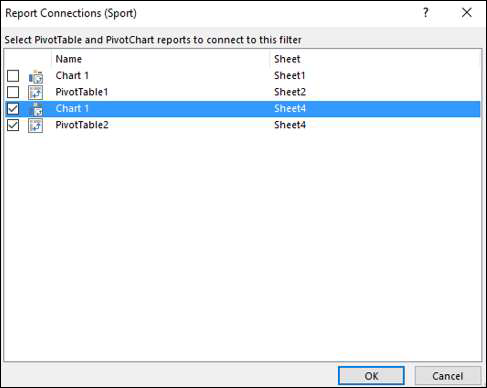
对 Sport Slicer 重复上述操作。
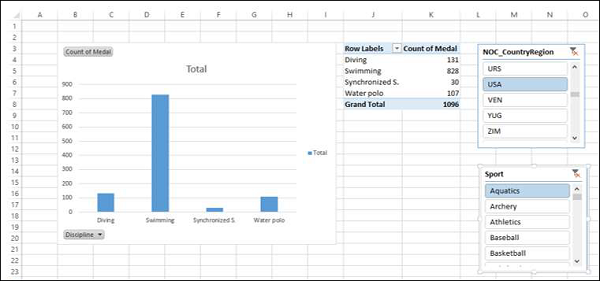
数据透视图也过滤为在两个切片器中选择的值。
接下来,您可以向数据透视图和数据透视表添加详细信息。
单击数据透视图。
将性别拖到图例区域。
右键单击数据透视图。
选择更改图表类型。
在"更改图表类型"对话框中选择堆积柱形。
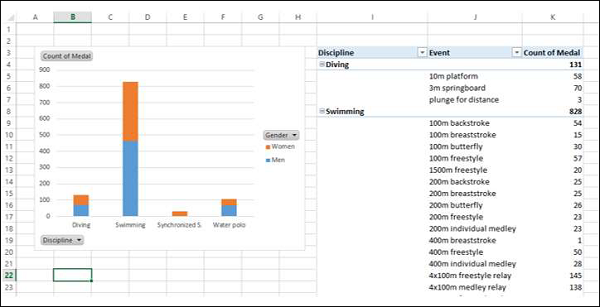
单击数据透视表。
将事件拖到 ROWS 区域。
单击功能区上 PIVOTTABLE TOOLS 中的 DESIGN 选项卡。
单击报告布局。
从下拉列表中选择"大纲表单"。
选择要在报表中显示的对象
您可以选择不在最终报告中显示切片器。
单击功能区上切片工具中的选项选项卡。
单击"排列"组中的"选择窗格"。 选择窗格出现在窗口的右侧。
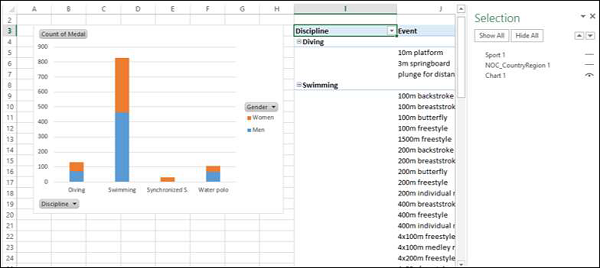
如您所见,符号  出现在选择窗格中的对象旁边。 这意味着这些对象是可见的。
点击 NOC_CountryRegion 旁边的
符号。点击运动旁边的
符号。 符号更改为  对于两者。 这意味着两个切片器的可见性已关闭。

关闭选择窗格。
您可以看到这两个切片器在报表中是不可见的。


