Kibana - 使用 Kibana 创建报告
使用 Kibana UI 中的共享按钮可以轻松创建报告。
Kibana 中的报告有以下两种形式 −
- 永久链接
- CSV 报告
报告为永久链接
执行可视化时,您可以按如下方式共享 −
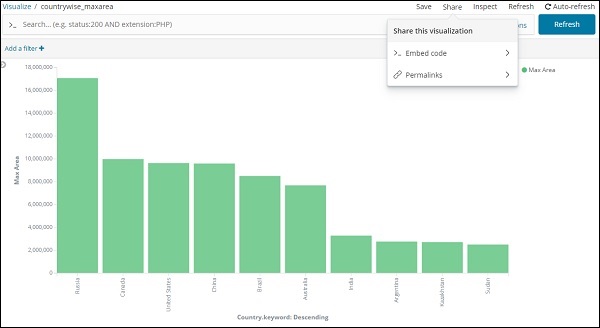
使用共享按钮将可视化作为嵌入代码或永久链接与其他人共享。
如果是嵌入代码,您将获得以下选项 −
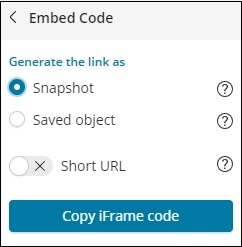
您可以为快照或已保存的对象生成 iframe 代码作为短网址或长网址。快照不会提供最近的数据,用户将能够看到共享链接时保存的数据。之后所做的任何更改都不会反映出来。
对于已保存的对象,您将获得对该可视化所做的最近更改。
长网址的快照 IFrame 代码 −
<iframe src="http://localhost:5601/app/kibana#/visualize/edit/87af
cb60-165f-11e9-aaf1-3524d1f04792?embed=true&_g=()&_a=(filters:!(),linked:!f,query:(language:lucene,query:''),
uiState:(),vis:(aggs:!((enabled:!t,id:'1',params:(field:Area),schema:metric,type:max),(enabled:!t,id:'2',p
arams:(field:Country.keyword,missingBucket:!f,missingBucketLabel:Missing,order:desc,orderBy:'1',otherBucket:!
f,otherBucketLabel:Other,size:10),schema:segment,type:terms)),params:(addLegend:!t,addTimeMarker:!f,addToo
ltip:!t,categoryAxes:!((id:CategoryAxis-1,labels:(show:!t,truncate:100),position:bottom,scale:(type:linear),
show:!t,style:(),title:(),type:category)),grid:(categoryLines:!f,style:(color:%23eee)),legendPosition:right,
seriesParams:!((data:(id:'1',label:'Max+Area'),drawLi
nesBetweenPoints:!t,mode:stacked,show:true,showCircles:!t,type:histogram,valueAxis:ValueAxis-1)),times:!(),
type:histogram,valueAxes:!((id:ValueAxis-1,labels:(filter:!f,rotate:0,show:!t,truncate:100),name:LeftAxis-1,
position:left,scale:(mode:normal,type:linear),show:!t,style:(),title:(text:'Max+Area'),type:value))),title:
'countrywise_maxarea+',type:histogram))" height="600" width="800"></iframe>
快照 iframe 代码用于短网址 −
<iframe src="http://localhost:5601/goto/f0a6c852daedcb6b4fa74cce8c2ff6c4?embed=true" height="600" width="800"><iframe>
作为快照和快照网址。
使用短网址 −
http://localhost:5601/goto/f0a6c852daedcb6b4fa74cce8c2ff6c4
关闭短网址后,链接如下所示 −
http://localhost:5601/app/kibana#/visualize/edit/87afcb60-165f-11e9-aaf1-3524d1f04792?_g=()&_a=(filters:!(
),linked:!f,query:(language:lucene,query:''),uiState:(),vis:(aggs:!((enabled:!t,id:'1',params:(field:Area),
schema:metric,type:max),(enabled:!t,id:'2',params:(field:Country.keyword,missingBucket:!f,missingBucketLabel:
Missing,order:desc,orderBy:'1',otherBucket:!f,otherBucketLabel:Other,size:10),schema:segment,type:terms)),
params:(addLegend:!t,addTimeMarker:!f,addTooltip:!t,categoryAxes:!((id:CategoryAxis-1,labels:(show:!t,trun
cate:100),position:bottom,scale:(type:linear),show:!t,style:(),title:(),type:category)),grid:(categoryLine
s:!f,style:(color:%23eee)),legendPosition:right,seriesParams:!((data:(id:'1',label:'Max%20Area'),drawLines
BetweenPoints:!t,mode:stacked,show:true,showCircles:!t,type:histogram,valueAxis:ValueAxis-1)),times:!(),
type:histogram,valueAxes:!((id:ValueAxis-1,labels:(filter:!f,rotate:0,show:!t,truncate:100),name:LeftAxis-1,
position:left,scale:(mode:normal,type:linear),show:!t,style:(),title:(text:'Max%20Area'),type:value))),title:'countrywise_maxarea%20',type:histogram))
当您在浏览器中点击上述链接时,您将获得与上图相同的可视化效果。上述链接托管在本地,因此在本地环境之外使用时将不起作用。
CSV 报告
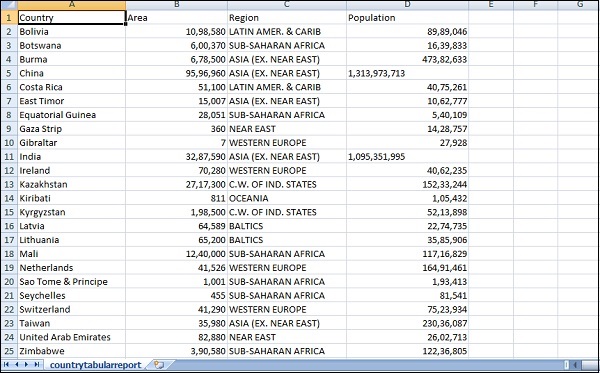
您可以在 Kibana 中获取包含数据的 CSV 报告,这些数据主要位于"发现"选项卡中。
转到"发现"选项卡并获取您想要数据的任何索引。这里我们获取的是 index:countriesdata-26.12.2018。以下是索引中显示的数据 −
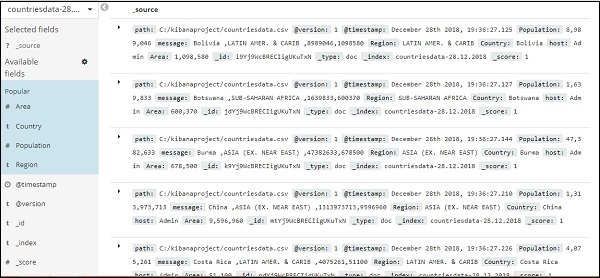
您可以从上述数据创建表格数据,如下所示 −
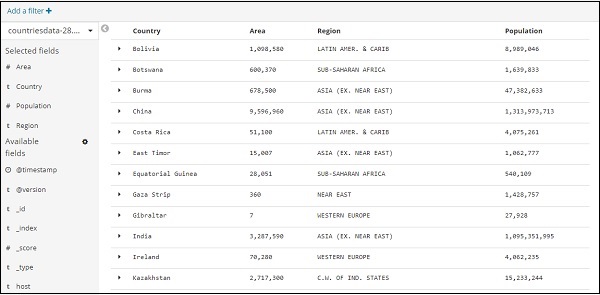
我们从可用字段中选择了字段,之前看到的数据已转换为表格格式。
您可以在 CSV 报告中获取上述数据,如下所示 −
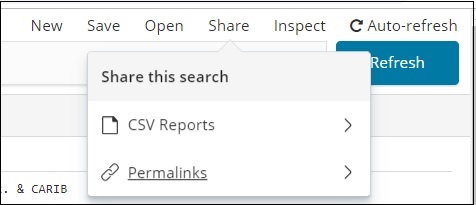
共享按钮有 CSV 报告和永久链接选项。您可以单击 CSV 报告并下载。
请注意获取保存数据所需的 CSV 报告。
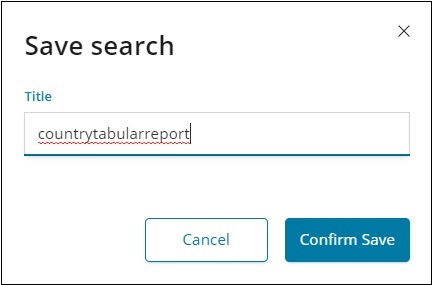
确认保存并单击共享按钮和 CSV 报告。您将获得以下显示 −
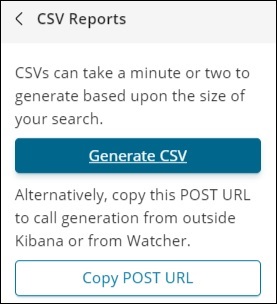
单击生成 CSV 以获取报告。完成后,它将指示您进入管理选项卡。
转到管理选项卡 →报告
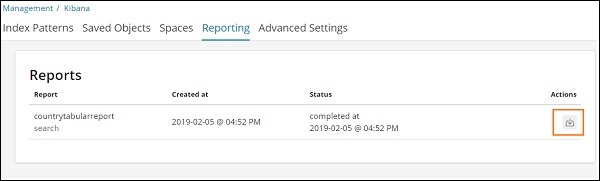
它显示报告名称、创建时间、状态和操作。您可以点击上面突出显示的下载按钮并获取您的 csv 报告。
我们刚刚下载的 CSV 文件如下所示 −