直方图桶
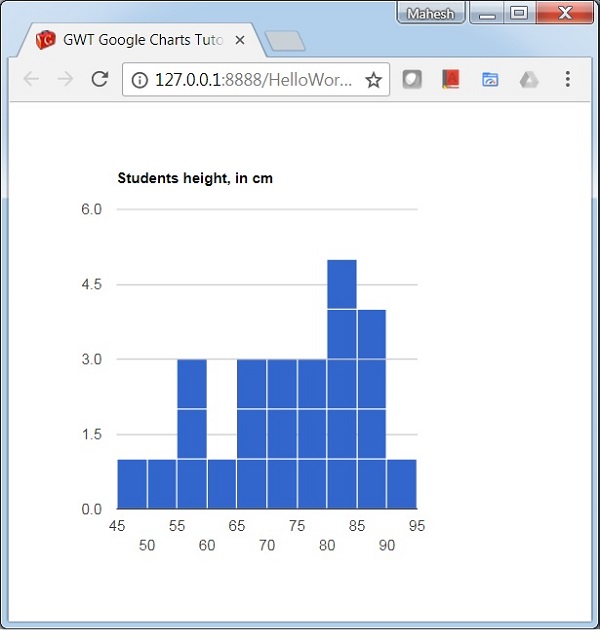
以下是具有自定义桶大小的直方图示例。
我们已经在 Google 图表配置语法 一章中看到了用于绘制图表的配置。现在,让我们看一个具有自定义桶大小的直方图示例。
配置
我们已经使用 bucketSize 配置来更改直方图的默认桶大小。
options.setBucketSize(5);
示例
HelloWorld.java
package com.tutorialspoint.client;

import com.google.gwt.core.client.EntryPoint;
import com.google.gwt.user.client.ui.RootPanel;

import com.googlecode.gwt.charts.client.ChartLoader;
import com.googlecode.gwt.charts.client.ChartPackage;
import com.googlecode.gwt.charts.client.DataTable;
import com.googlecode.gwt.charts.client.corechart.Histogram;
import com.googlecode.gwt.charts.client.corechart.HistogramOptions;
import com.googlecode.gwt.charts.client.options.Legend;
import com.googlecode.gwt.charts.client.options.LegendPosition;
import com.googlecode.gwt.charts.client.util.ChartHelper;

public class HelloWorld implements EntryPoint {
   private Histogram chart;

   private void initialize() {
      ChartLoader chartLoader = new ChartLoader(ChartPackage.CORECHART);
      chartLoader.loadApi(new Runnable() {
         public void run() {
            // 创建并附加图表
            chart = new Histogram();
            RootPanel.get().add(chart);
            draw();
         }
      });
   }
   private void draw() {
      // 准备数据
      Object[][] data = new Object[][] { { "Student Roll No", "height" },
         {"1", 80},{"2", 55},{"3", 68},{"4", 80},{"5", 54},
         {"6", 70},{"7", 85},{"8", 78},{"9", 70},{"10", 58},
         {"11", 90},{"12", 65},{"13", 88},{"14", 82},{"15", 65},
         {"16", 86},{"17", 45},{"18", 62},{"19", 84},{"20", 75},
         {"21", 82},{"22", 75},{"23", 58},{"24", 70},{"25", 85}
      };
      DataTable dataTable = ChartHelper.arrayToDataTable(data);

      // 设置选项
      HistogramOptions options = HistogramOptions.create();
      options.setTitle("Students height, in cm");
      options.setLegend(Legend.create(LegendPosition.NONE));
      options.setBucketSize(5);

      // 绘制图表
      chart.draw(dataTable,options);
      chart.setWidth("400px");
      chart.setHeight("400px");
   }
   public void onModuleLoad() {
      initialize();
   }
}
结果
验证结果。
 gwt_googlecharts_histogram_charts.html


