CodeIgniter - 基准测试
设置基准测试点
如果您想要测量执行一组行或内存使用所花费的时间,您可以使用 CodeIgniter 中的基准测试点来计算。CodeIgniter 中有一个单独的"基准测试"类用于此目的。
该类会自动加载;您不必加载它。它可以在您的控制器、视图和模型类中的任何位置使用。您所要做的就是标记一个起点和终点,然后在这两个标记点之间执行 elapsed_time() 函数,您就可以获得执行该代码所花费的时间,如下所示。
<?php
   $this->benchmark->mark('code_start');

   // Some code happens here

   $this->benchmark->mark('code_end');

   echo $this->benchmark->elapsed_time('code_start', 'code_end');
?>
要显示内存使用情况,请使用函数 memory_usage(),如以下代码所示。
<?php
    echo $this->benchmark->memory_usage();
?>
示例
创建一个名为 Profiler_controller.php 的控制器,并将其保存在 application/controller/Profiler_controller.php
<?php
   class Profiler_controller extends CI_Controller {

      public function index() {

         //enable profiler
         $this->output->enable_profiler(TRUE);
         $this->load->view('test');
      }

      public function disable() {

         //disable profiler
         $this->output->enable_profiler(FALSE);
         $this->load->view('test');
      }

   }
?>
创建一个名为 test.php 的视图文件并将其保存在 application/views/test.php
<!DOCTYPE html>
<html lang = "en">

   <head>
      <meta charset = "utf-8">
      <title>CodeIgniter View Example</title>
   </head>

   <body>
      CodeIgniter View Example
   </body>

</html>
更改 application/config/routes.php 处的 routes.php 文件以添加上述控制器的路由,并在文件末尾添加以下行。
$route['profiler'] = "Profiler_controller";
$route['profiler/disable'] = "Profiler_controller/disable"
之后,您可以在浏览器的地址栏中输入以下 URL 来执行示例。
http://yoursite.com/index.php/profiler
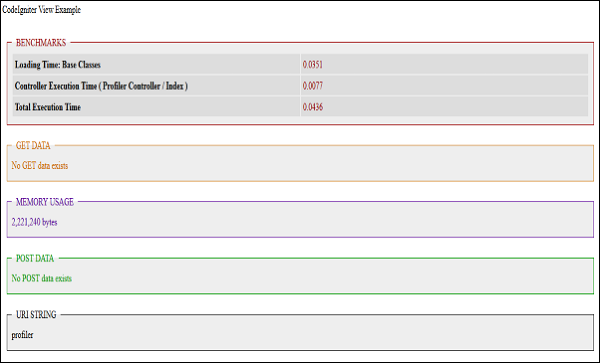
上述 URL 将启用分析器,并将生成输出,如以下屏幕截图所示。
要禁用分析,请执行以下 URL。
http://yoursite.com/index.php/profiler/disable


