如何在 Matplotlib 中将多幅图像显示在一幅图中?
matplotlibserver side programmingprogramming
要在 Matplotlib 中将多幅图像显示在一幅图中,我们可以执行以下步骤 −
使用 numpy 创建随机数据。
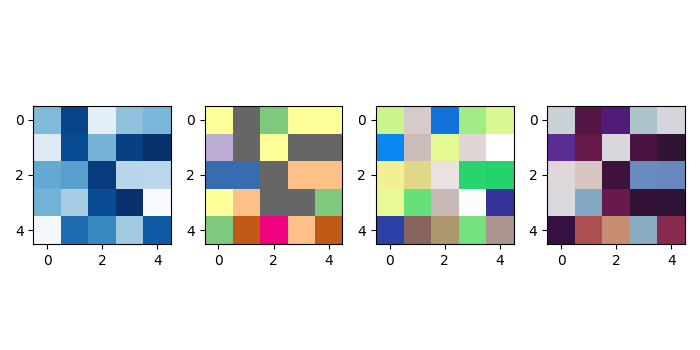
在当前图形中添加一个子图,nrows=1,ncols=4,位于 index=1。
使用 imshow() 方法,并传入 cmap="Blues_r",将数据显示为图像,即在二维常规栅格上。
在当前图形中添加一个子图,nrows=1,ncols=4,位于索引=2。
使用 imshow() 方法和cmap="Accent_r",将数据显示为图像,即在二维常规栅格上。
向当前图形添加子图,nrows=1,ncols=4,索引=3。
使用 imshow()方法和cmap="terrain_r",将数据显示为图像,即在二维常规栅格上。
向当前图形添加子图,nrows=1,ncols=4,索引= index=4.
使用 imshow() 方法和 cmap="twilight_shifted_r" 将数据显示为图像,即在二维常规栅格上。
要显示图形,请使用 show() 方法。
示例
import numpy as np
from matplotlib import pyplot as plt
plt.rcParams["figure.figsize"] = [7.00, 3.50]
plt.rcParams["figure.autolayout"] = True
data = np.random.rand(5, 5)
plt.subplot(1, 4, 1)
plt.imshow(data, cmap="Blues_r")
plt.subplot(1, 4, 2)
plt.imshow(data, cmap="Accent_r")
plt.subplot(1, 4, 3)
plt.imshow(data, cmap="terrain_r")
plt.subplot(1, 4, 4)
plt.imshow(data, cmap="twilight_shifted_r")
plt.show()
输出