如何在 Matplotlib 中绘制带有图例的多个双列文本文件的数据?
matplotlibserver side programmingprogramming
要在 Matplotlib 中绘制带有图例的多个双列文本文件的数据,我们可以采取以下步骤 −
从 pylab 导入 genfromtxt 。它提供了多种从文本文件读取数据并绘制数据的选项。
使用 genfromtxt 读取两个文本文件 test.txt 和 test1.txt(包含两列数据),并将数据存储在两个变量 firstfiledata 和 secondfiledata 中。
使用 plot() 方法绘制数据。标签将显示为图例。
要显示图形,请使用 show() 方法。
示例
from matplotlib import pyplot as plt;
from pylab import genfromtxt;

plt.rcParams["figure.figsize"] = [7.00, 3.50]
plt.rcParams["figure.autolayout"] = True

firstfiledata = genfromtxt("test.txt");
secondfiledata = genfromtxt("test1.txt");
plt.plot(firstfiledata[:, 0], firstfiledata[:, 1], label="test.txt Data");
plt.plot(secondfiledata[:, 0], secondfiledata[:, 1], label="test1.txt Data");
plt.legend();
plt.show();
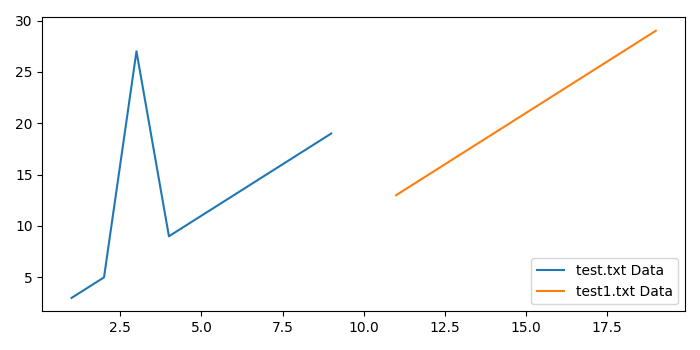
输出
假设两个文本文件包含以下数据 −
test.txt
========
1    3
2    5
3    27
4    9
5    11
6    13
7    15
8    17
9    19
test1.txt
=========
11    13
12    15
13    17
14    19
15    21
16    23
17    25
18    27
19    29
当我们执行代码时,它将产生以下输出 −