如何隐藏 Matplotlib 3D 中的轴?
matplotlibserver side programmingprogramming
要隐藏 matplotlib 3D 中的轴,我们可以采取以下步骤−
- 创建一个 2D 数组,其中 x、y、z、u、v 和 w 是箭头位置的坐标和箭头向量的方向分量。
- 使用 figure() 方法创建一个新图形或激活一个现有图形。
- 添加一个 '~.axes.Axes'使用 add_subplot() 方法将图形作为子图布置的一部分添加至该图形
- 使用 quiver() 方法绘制箭头的 3D 场。
- 使用 ylim、xlim、zlim 限制轴的范围
- 设置图的标题。
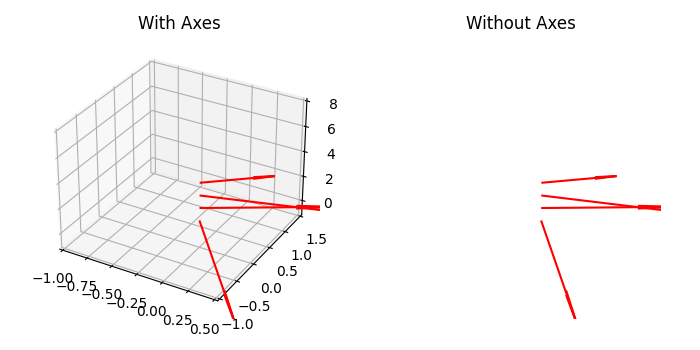
- 创建两个轴(ax1 和 ax2)。设置标题"带轴"和"不带轴"。使用 set_axis_off() 方法,我们可以隐藏轴。
- 要显示图形,请使用 show() 方法。
示例
import matplotlib.pyplot as plt
import numpy as np
plt.rcParams["figure.figsize"] = [7.00, 3.50]
plt.rcParams["figure.autolayout"] = True
soa = np.array([[0, 0, 1, 1, -2, 0], [0, 0, 2, 1, 1, 0],
[0, 0, 3, 2, 1, 0], [0, 0, 4, 0.5, 0.7, 0]])
X, Y, Z, U, V, W = zip(*soa)
fig = plt.figure()
ax = fig.add_subplot(121, projection='3d')
ax.quiver(X, Y, Z, U, V, W, color='red')
ax.set_xlim([-1, 0.5])
ax.set_ylim([-1, 1.5])
ax.set_zlim([-1, 8])
ax.set_title("With Axes")
ax1 = fig.add_subplot(122, projection='3d')
ax1.set_axis_off()
ax1.quiver(X, Y, Z, U, V, W, color='red')
ax1.set_xlim([-1, 0.5])
ax1.set_ylim([-1, 1.5])
ax1.set_zlim([-1, 8])
ax1.set_title("Without Axes")
plt.show()
输出