Seaborn.husl_palette() 方法
Seaborn.husl_palette() 方法用于获取一组均匀分布的颜色,这些颜色是 HUSL 颜色空间的一部分。
HUSL 颜色空间根据颜色的色调、饱和度和亮度定义颜色。 这些色调沿圆形路径均匀分布,从而形成适用于分类或循环数据的调色板。
此函数使用在感知上更均匀的非线性颜色空间,但在其他方面类似于 hls_palette() 方法。 HSL 的值应始终介于 0 和 1 之间。
语法
以下是 husl_palette() 方法的语法 −
seaborn.husl_palette(n_colors=6, h=0.01, s=0.9, l=0.65, as_cmap=False)
参数
husl_palette 方法的参数说明如下。
| S.No | 参数及说明 |
|---|---|
| 1 | n_colors 循环中的颜色数量。 |
| 2 | h 采用浮点数,是颜色循环的第一个色调。 |
| 3 | s 取浮点值是颜色的饱和度。 |
| 4 | l 采用浮点值,它是颜色的亮度。 |
返回值
它返回 RGB 元组列表和 matplotlib 颜色图。
示例 1
在这个例子中,我们将了解 husl_palette() 方法的工作原理。 这种方法基本上允许用户通过更改颜色的色调、亮度和饱和度来创建自定义调色板。 要绘制自定义创建的调色板,使用 palplot() 方法。
此 seaborn.palplot() 方法使用户能够绘制自定义调色板并查看属于特定调色板的 pantones。 color_palette 和 palplto() 方法之间的区别在于 color_palette() 方法绘制 matplotlib 调色板的颜色,而 palplot() 方法用于绘制自定义调色板。
import seaborn as sns
import matplotlib.pyplot as plt
titanic=sns.load_dataset("titanic")
titanic.head()
sns.palplot(sns.husl_palette(15))
plt.show()
输出
得到的输出如下 −

示例 2
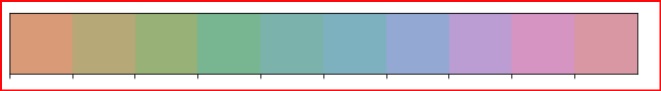
在此示例中,我们将把色调值与 n_colors 值一起传递给 husl_paletee() 方法。 此处,色调值设置为 0.4,这是自定义颜色系列中第一个色调的值。
import seaborn as sns
import matplotlib.pyplot as plt
titanic=sns.load_dataset("titanic")
titanic.head()
sns.palplot(sns.husl_palette(15,h=0.4))
plt.show()
输出
得到的输出是下面这一系列的颜色 −

示例 3
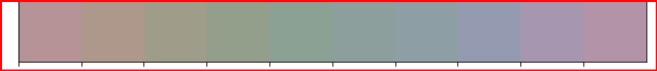
在这里,我们会将饱和度值与 n 色值一起传递给该方法。 在此示例中,饱和度设置为 0.2。
import seaborn as sns
import matplotlib.pyplot as plt
titanic=sns.load_dataset("titanic")
titanic.head()
sns.palplot(sns.husl_palette(10, s=.2))
plt.show()
输出
产生的输出如下 −
示例 4
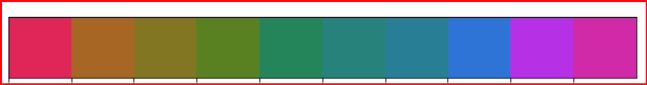
在这里,我们会将亮度值与 n_colors 值一起传递给该方法。 在此示例中,亮度设置为 0.5。
import seaborn as sns
import matplotlib.pyplot as plt
titanic=sns.load_dataset("titanic")
titanic.head()
sns.palplot(sns.husl_palette(10, l=.5))
plt.show()
输出
产生的输出如下 −
示例 5
在这里,我们会将所有参数传递给 husl_palette() 方法,然后绘制颜色。
import seaborn as snsn
import matplotlib.pyplot as plt
titanic=sns.load_dataset("titanic")
titanic.head()
sns.palplot(sns.husl_palette(10, l=.7,s=.5,h=0.1))
plt.show()
输出
产生的输出如下 −