Polymer - Google Chart
<google-chart> 是一个包含用于可视化数据的图表的元素。此元素包含各种图表,例如 饼图、折线图、柱形图、面积图、树形图 等。
注意 − 对于有效的 JSON,如果您将 JSON 作为属性传递,则必须使用单引号。
您可以将高度和宽度指定为样式属性,如下所示 −
google-chart {
   height: 100px;
   width: 300px;
}
您可以使用以下任何一种方式提供数据 −
- 使用 cols 和 rows 属性。
cols = '[{"label":"Month", "type":"string"}, {"label":"Days", "type":"number"}]'
rows = '[["Oct", 31],["Nov", 30],["Dec", 31]]'
- 使用 data 属性,您可以直接传入数据。
data = '[["Month", "Days"], ["Oct", 31], ["Nov", 30], ["Dec", 31]]'
- 使用 data 属性,您可以在 URL 中传递数据。
data = 'http://demo.com/chart-data.json'
- 使用 data 属性,您可以在 Google DataTable 对象中传递数据
data = '{{dataTable}}'
- 使用 view 属性
view = '{{dataView}}'
如果您想在 "en" 以外的语言环境中显示图表,您可以在 html 标记上设置 lang 属性,如以下代码片段所示。
<html lang = "ja">
示例
要使用 google-chart 元素,请在命令提示符中导航到您的项目文件夹并使用以下命令。
bower install PolymerElements/google-chart --save
上述命令在 bower_components 文件夹中安装 google-chart 元素。接下来,使用以下命令在 index.html 中导入 google-chart 文件。
<link rel = "import" href = "/bower_components/google-chart/google-chart.html">
以下示例演示了 google-chart 元素的使用。
<!DOCTYPE html>
<html>
   <head>
      <title>google-chart</title>
      <base href = "http://polygit.org/components/">
      <script src = "webcomponentsjs/webcomponents-lite.min.js"></script>
      <link rel = "import" href = "google-chart/google-chart.html">
   </head>

   <body>
      <google-chart
         type = 'pie'
         options = '{"title": "Pie Chart", "vAxis": {"minValue" : 0, "maxValue": 8}}'
         cols = '[{"label": "Country", "type": "string"},{"label": "Value", "type": "number"}]'
         rows = '[["Germany", 5.0],["US", 4.0],["Africa", 11.0],["France", 4.0]]'>
      </google-chart>
   </body>
</html>
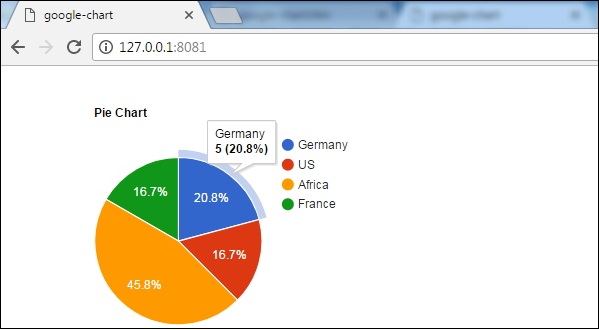
输出
要运行应用程序,请导航到您的项目目录并运行以下命令。
polymer serve
现在打开浏览器并导航到 http://127.0.0.1:8081/。以下是输出。
 polymer_elements.html

