如何在 Seaborn 中查看axes_style中的参数?
Seaborn 的'axes_style()'函数允许我们通过修改各种参数来自定义绘图的样式。它返回一个参数字典,这些参数控制绘图元素的外观,例如颜色、字体、网格线等。要查看这些参数,我们可以打印'axes_style()'返回的字典。
导入所需的库
在开始之前,让我们导入必要的库。我们需要使用以下命令导入 Seaborn。
import seaborn as sns
查看参数
要查看 'axes_style()' 中的可用参数,我们可以简单地打印函数返回的字典。
示例
当我们运行以下代码时,它将打印一个包含当前样式的默认参数值的字典。
import seaborn as sns
# 打印axes_style中的参数
print(sns.axes_style())
输出
{'axes.facecolor': 'white', 'axes.edgecolor': '.15', 'axes.grid': False, 'axes.axisbelow': True, 'axes.labelcolor': '.15', 'figure.facecolor': 'white', 'grid.color': '.8', 'grid.linestyle': '-', 'text.color': '.15', 'xtick.color': '.15', 'ytick.color': '.15', 'xtick.direction': 'out', 'ytick.direction': 'out', 'lines.solid_capstyle': , 'patch.edgecolor': 'w', 'patch.force_edgecolor': True, 'image.cmap': 'rocket', 'font.family': ['sans-serif'], 'font.sans-serif': ['Arial', 'DejaVu Sans', 'Liberation Sans', 'Bitstream Vera Sans', 'sans-serif'], 'xtick.bottom': True, 'xtick.top': False, 'ytick.left': True, 'ytick.right': False, 'axes.spines.left': True, 'axes.spines.bottom': True, 'axes.spines.right': True, 'axes.spines.top': True}
输出字典包含各种参数,用于定义不同绘图元素的样式。其中我们来看看一些常用的参数。
''axes.facecolor'' − 轴的背景颜色。
''axes.edgecolor'' − 轴边缘的颜色。
''axes.grid'' − 是否在图中显示网格线。
''axes.axisbelow'' − 网格线是否绘制在绘图元素下方。
''axes.labelcolor'' − 轴标签的颜色。
''figure.facecolor'' − 图形的背景颜色。
这些只是几个例子,还有更多参数可用于控制绘图外观的不同方面。
应用样式并查看参数
要查看特定样式的参数,我们可以使用"sns.set_style()"应用该样式,然后打印"sns.axes_style()"返回的字典。
通过使用"sns.set_style()"应用特定样式,我们可以看到特定于该样式的参数。例如,如果我们将样式设置为"darkgrid",则打印的字典将包含"darkgrid"样式的参数。
示例
import seaborn as sns

# 应用样式
sns.set_style('darkgrid')
# 打印axes_style中已应用样式的参数
print(sns.axes_style())
输出
{'axes.facecolor': '#EAEAF2', 'axes.edgecolor': 'white', 'axes.grid': True, 'axes.axisbelow': True, 'axes.labelcolor': '.15', 'figure.facecolor': 'white', 'grid.color': 'white', 'grid.linestyle': '-', 'text.color': '.15', 'xtick.color': '.15', 'ytick.color': '.15', 'xtick.direction': 'out', 'ytick.direction': 'out', 'lines.solid_capstyle': , 'patch.edgecolor': 'w', 'patch.force_edgecolor': True, 'image.cmap': 'rocket', 'font.family': ['sans-serif'], 'font.sans-serif': ['Arial', 'DejaVu Sans', 'Liberation Sans', 'Bitstream Vera Sans', 'sans-serif'], 'xtick.bottom': False, 'xtick.top': False, 'ytick.left': False, 'ytick.right': False, 'axes.spines.left': True, 'axes.spines.bottom': True, 'axes.spines.right': True, 'axes.spines.top': True}
使用参数自定义绘图样式
查看可用参数后,我们可以使用它们自定义绘图样式。要修改特定参数,我们可以将其作为参数传递给"sns.set_style()"。
示例
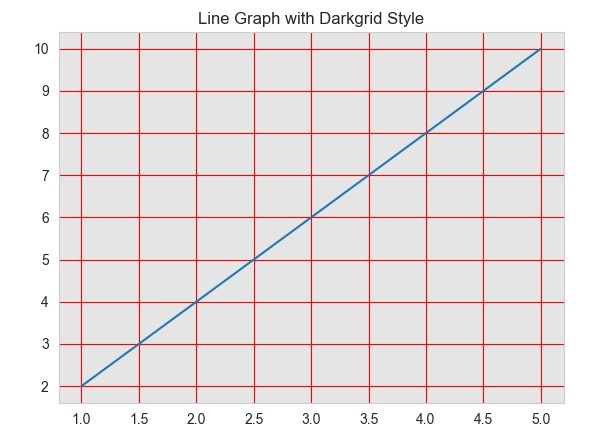
在此示例中,我们通过将参数字典作为第二个参数传递给"sns.set_style()"来自定义绘图样式。我们将 ''axes.facecolor'' 参数设置为浅灰色,将 ''grid.color'' 参数设置为红色,将 ''axes.labelcolor'' 参数设置为蓝色。
import seaborn as sns
import matplotlib.pyplot as plt

# 生成一些用于绘图的随机数据
x = [1, 2, 3, 4, 5]
y = [2, 4, 6, 8, 10]

# 将样式设置为"darkgrid"
sns.set_style("darkgrid")

# 使用参数自定义绘图样式
sns.set_style(
    'whitegrid',
    {'axes.facecolor': '#E5E5E5', 'grid.color': 'red', 'axes.labelcolor': 'blue'}
)

# 绘制使用 darkgrid 样式的线图
plt.plot(x, y)
plt.title("使用 Darkgrid 样式的线图")
plt.show()
输出