如何在 Python Plotly 中将多个图形绘制为子图?
plotlypythonserver side programmingprogramming
Plotly 是一个用于创建图表的开源 Python 库。您可以使用 Plotly 中提供的功能将多个图形设置为子图。
在本教程中,我们将使用 plotly.graph_objects 来生成图形。它包含许多方法来自定义图表并将图表呈现为 HTML 格式。例如,可以使用 plotly.subplots() 方法添加子图。
按照下面给出的步骤使用 Plotly express 创建子图。
步骤 1
将 plotly.graphs_objs 模块和别名导入为 go。
import plotly.graphs_objs as go
步骤 2
导入 make_subplots 以创建子图。
from plotly.subplots import make_subplots
步骤 3
创建 3 行 1 列的子图。
fig = make_subplots(rows=3, cols=1)
步骤 4
创建 append_trace() 方法来附加散点图。
fig.append_trace(go.Scatter(
   x=[1,2,3,4,5],
   y=[5,6,7,8,9],
), row=1, col=1)

fig.append_trace(go.Scatter(
   x=[3,4,5,6,7],
   y=[10,11,12,9,8],
), row=2, col=1)

fig.append_trace(go.Scatter(
   x=[4,5,6,7,8],
   y=[6,7,8,9,10]
), row=3, col=1)
步骤 5
使用 update_layout() 方法设置布局大小。
fig.update_layout(height=400, width=400, title_text="Subplots")
示例
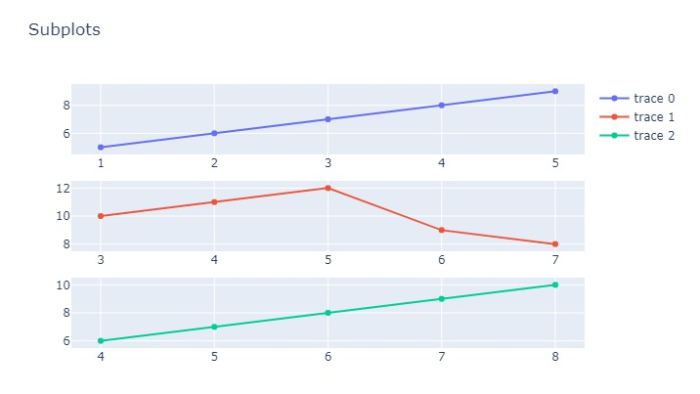
这是将多个图形绘制为子图的完整代码 -
from plotly.subplots import make_subplots
import plotly.graph_objects as go

fig = make_subplots(rows=3, cols=1)

fig.append_trace(go.Scatter(
   x=[1,2,3,4,5],
   y=[5,6,7,8,9],
), row=1, col=1)

fig.append_trace(go.Scatter(
   x=[3,4,5,6,7],
   y=[10,11,12,9,8],
), row=2, col=1)

fig.append_trace(go.Scatter(
   x=[4,5,6,7,8],
   y=[6,7,8,9,10]
), row=3, col=1)

fig.update_layout(height=450, width=716, title_text="Subplots")
fig.show()
输出
它将在浏览器上显示以下输出 -


