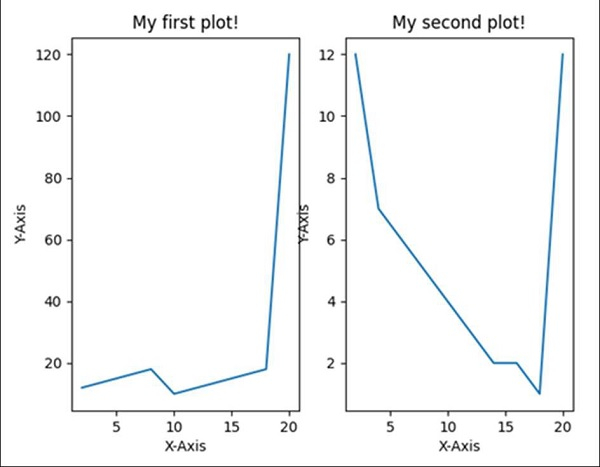
如何使用 Python 并排绘制两个图?
matplotlibserver side programmingprogrammingpython
使用 subplot(row, col, index) 方法,我们可以将一个图拆分为 row*col 个部分,并可以在索引位置绘制该图。在以下程序中,我们将在一个图中创建两个图表。
步骤
使用 numpy 创建 x、y1、y2 点。
使用 nrows = 1、ncols = 2、index = 1,使用 subplot() 方法将子图添加到当前图。
使用 x 和 y1 点绘制线条,使用 plot() 方法。
使用 plt.title() 设置图 1 的标题、X 轴和 Y 轴的标签,plt.xlabel() 和 plt.ylabel() 方法。
使用 subplot() 方法,在 nrows = 1、ncols = 2、index = 2 的情况下,向当前图形添加子图。
使用 plot() 方法,使用 x 和 y2 点绘制线条。
使用 plt.title()、plt.xlabel() 和 plt.ylabel() 方法,为图 2 设置标题、X 轴和 Y 轴的标签。
要显示图中,使用plt.show()方法。
示例
from matplotlib import pyplot as plt
import numpy as np

xPoints = np.array([2, 4, 6, 8, 10, 12, 14, 16, 18, 20])
y1Points = np.array([12, 14, 16, 18, 10, 12, 14, 16, 18, 120])
y2Points = np.array([12, 7, 6, 5, 4, 3, 2, 2, 1, 12])

plt.subplot(1, 2, 1) # row 1, col 2 index 1
plt.plot(xPoints, y1Points)
plt.title("My first plot!")
plt.xlabel('X-axis ')
plt.ylabel('Y-axis ')

plt.subplot(1, 2, 2) # index 2
plt.plot(xPoints, y2Points)
plt.title("My second plot!")
plt.xlabel('X-axis ')
plt.ylabel('Y-axis ')

plt.show()
输出

了解更多:Matplotlib 教程、Python 教程


