如何在 Python Plotly 中将鼠标悬停在某个点上时显示图像?
Plotly 是 Python 中的一个开源绘图库,可以生成多种不同类型的图表。Python 用户可以使用 Plotly 创建交互式的基于 Web 的可视化效果,这些可视化效果可以显示在 Jupyter 笔记本中、保存到独立的 HTML 文件中,或使用 Dash 作为 Web 应用程序的一部分。Plotly 还可用于静态文档发布和桌面编辑器,例如 PyCharm 和 Spyder。
Dash 是一个 Python 框架,用于创建交互式的基于 Web 的仪表板应用程序。 dash 库将所有必需的库添加到基于 Web 的仪表板应用程序中。
在本教程中,我们将展示如何在单个浏览器页面上向 Plotly Dash 应用程序添加多个图表。
按照下面给出的步骤在单个页面上生成 Dash 应用程序。
步骤 1
导入 Dash 库。
import dash
步骤 2
导入 Dash 核心组件 dcc 和 html。我们将使用 dcc.Graph() 方法设置高度和宽度坐标的样式。
from dash import dcc, html
步骤 3
使用以下模块导入 dash 依赖项。
from dash.dependencies import Input, Output
步骤 4
导入 plotly.express 模块并将其别名为 px。我们将使用此方法生成图表。
import plotly.express as px
步骤 5
使用 Pandas 模块生成数据集。
#generate dataframe
df = pd.DataFrame(
   dict(
      x=[1, 2],
      y=[2, 4],
      images=[dogImage,catImage],
   )
)
步骤 6
设置来自特定 URL 的图像。示例 URL 定义如下 −
dogImage = "data:image/png;base64,
catImage = "data:image/png;base64,
步骤 7
使用 X 和 Y 坐标创建散点图 −
# 使用 x 和 y 坐标创建散点图
fig = px.scatter(df, x="x", y="y",custom_data=["images"])
步骤 8
使用以下命令创建 main 函数以运行应用服务器 −
app = dash.Dash(__name__)
if __name__ == '__main__':
app.run_server(debug=True)
步骤 9
使用 update_layout() 方法执行点击模式,并设置 update_traces() 方法执行标记大小。
# 更新布局和更新轨迹
fig.update_layout(clickmode='event+select')
fig.update_traces(marker_size=20)
步骤 10
生成 App 布局以显示 Dash 图表。它定义如下,
# 创建 App 布局以显示 Dash 图表
app.layout = html.Div(
   [
      dcc.Graph(
         id="graph_interaction",
         figure=fig,
      ),
      html.Img(id='image', src='')
   ]
)
步骤 11
创建 callback() 函数以将数据悬停在特定坐标上,如下所示 −
@app.callback(
   Output('image', 'src'),
   Input('graph_interaction', 'hoverData'))

def open_url(hoverData):
   if hoverData:
      return hoverData["points"][0]["customdata"][0]
   else:
      raise PreventUpdate

# 创建应用程序布局以显示破折号图
app.layout = html.Div(
   [
      dcc.Graph(
         id="graph_interaction",
         figure=fig,
      ),
      html.Img(id='image', src='')
   ]
)
示例
在悬停虚线图上显示图像的完整代码,
import dash
from dash.exceptions import PreventUpdate
from dash import dcc, html
from dash.dependencies import Input, Output
import plotly.express as px
import pandas as pd

# Create dash app
app = dash.Dash(__name__)

# Set dog and cat images
dogImage = "https://www.iconexperience.com/_img/v_collection_png/256x256/shadow/dog.png"
catImage = "https://d2ph5fj80uercy.cloudfront.net/06/cat3602.jpg"

# Generate dataframe
df = pd.DataFrame(
   dict(
      x=[1, 2],
      y=[2, 4],
      images=[dogImage,catImage],
   )
)

# Create scatter plot with x and y coordinates
fig = px.scatter(df, x="x", y="y",custom_data=["images"])

# Update layout and update traces
fig.update_layout(clickmode='event+select')
fig.update_traces(marker_size=20)

# Create app layout to show dash graph
app.layout = html.Div(
   [
      dcc.Graph(
         id="graph_interaction",
         figure=fig,
      ),
      html.Img(id='image', src='')
   ]
)

# html callback function to hover the data on specific coordinates
@app.callback(
   Output('image', 'src'),
   Input('graph_interaction', 'hoverData'))
   def open_url(hoverData):
   if hoverData:
      return hoverData["points"][0]["customdata"][0]
   else:
      raise PreventUpdate

if __name__ == '__main__':
   app.run_server(debug=True)
输出
它将在控制台上显示以下输出。
Dash is running on http://127.0.0.1:8050/

* Serving Flask app 'main'
* Debug mode: on
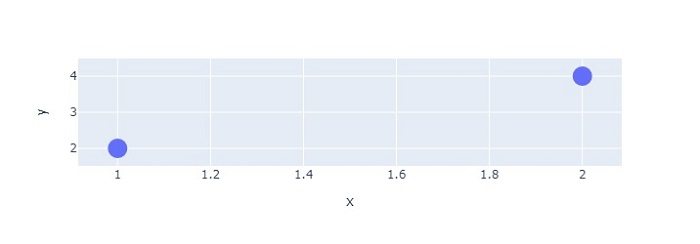
单击 URL,它将在浏览器上显示输出 -
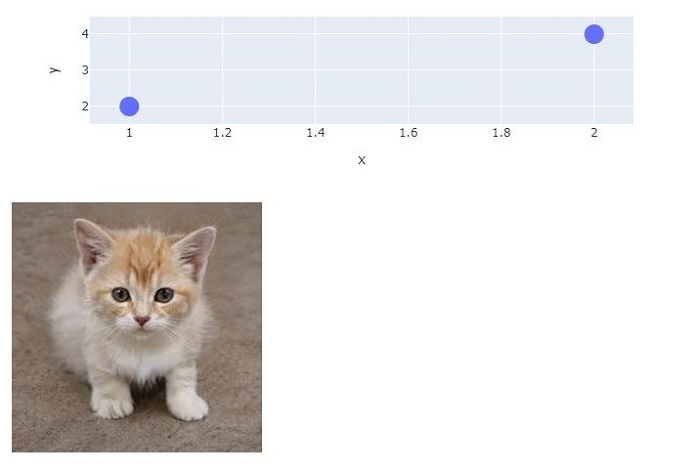
现在,将鼠标悬停在坐标 (1,2) 上,您将看到以下输出 -
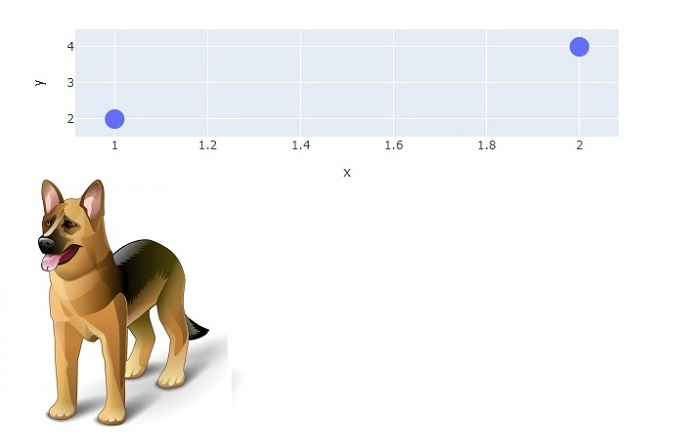
同样,当您将鼠标悬停在第二点,它将产生以下输出 -