如何使用 Tensorflow 和预训练模型来理解学习曲线?
tensorflowserver side programmingprogramming
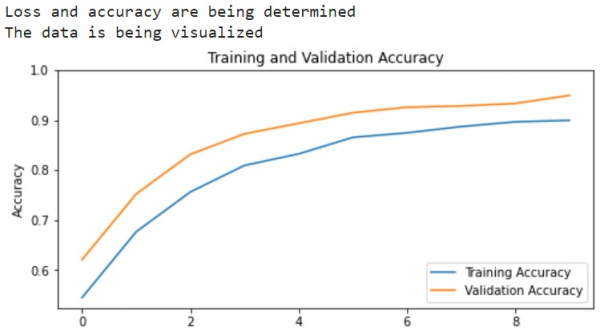
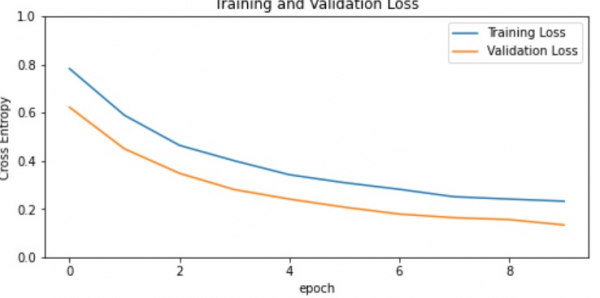
Tensorflow 和预训练模型可用于通过可视化对输入数据集执行的操作来理解学习曲线。借助‘matplotlib’库绘制训练准确度和验证准确度。训练损失和验证损失也被可视化。
阅读更多: 什么是 TensorFlow,以及 Keras 如何与 TensorFlow 配合使用来创建神经网络?
包含至少一个层的神经网络称为卷积层。我们可以使用卷积神经网络构建学习模型。
我们将了解如何借助预训练网络的迁移学习对猫和狗的图像进行分类。图像分类迁移学习背后的直觉是,如果在大型通用数据集上训练模型,则该模型可有效地用作视觉世界的通用模型。它会学习特征图,这意味着用户不必从头开始在大型数据集上训练大型模型。
阅读更多: 如何预先训练定制模型?
我们使用 Google Colaboratory 运行以下代码。Google Colab 或 Colaboratory 有助于在浏览器上运行 Python 代码,并且不需要任何配置,并且可以免费访问 GPU(图形处理单元)。Colaboratory 是在 Jupyter Notebook 之上构建的。
示例
print("Loss and accuracy are being determined")
acc = history.history['accuracy']
val_acc = history.history['val_accuracy']
loss = history.history['loss']
val_loss = history.history['val_loss']
print("The data is being visualized")
plt.figure(figsize=(8, 8))
plt.subplot(2, 1, 1)
plt.plot(acc, label='Training Accuracy')
plt.plot(val_acc, label='Validation Accuracy')
plt.legend(loc='lower right')
plt.ylabel('Accuracy')
plt.ylim([min(plt.ylim()),1])
plt.title('Training and Validation Accuracy')
plt.subplot(2, 1, 2)
plt.plot(loss, label='Training Loss')
plt.plot(val_loss, label='Validation Loss')
plt.legend(loc='upper right')
plt.ylabel('Cross Entropy')
plt.ylim([0,1.0])
plt.title('Training and Validation Loss')
plt.xlabel('epoch')
plt.show()
代码来源 −https://www.tensorflow.org/tutorials/images/transfer_learning
输出
解释
训练和验证准确率/损失的学习曲线已可视化。
这是使用 MobileNet V2 基础模型作为固定特征提取器完成的。


