使用 pandas 和 matplotlib 进行不同的绘图
pythonpandasmatplotlibprogramming
Pandas 和 Matplotlib 是 Python 中可用的库,用于对给定的输入数据进行数据分析和可视化。以下是可以使用 pandas 和 matplotlib 库绘制的一些不同的图。
使用线图
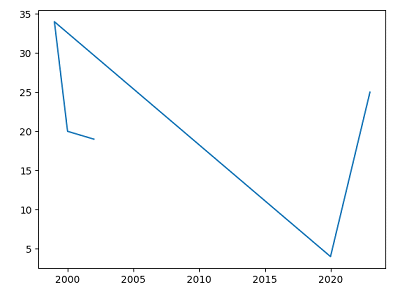
线图是随时间可视化数据的最简单的图;可以使用 pandas 和 matplotlib 库绘制此图。我们在 matplotlib 库中提供了 plot() 函数来绘制线图。以下是语法。
import matplotlib.pyplot as plt
plt.plot(x,y)
其中,
matplotlib.pylot 是库。
plt 是别名。
plot 是绘制线图的函数。
x, y 是要绘制的输入数据。
示例
在下面的示例中,我们将使用 pandas 库创建线图以可视化提供的数据 −
import matplotlib.pyplot as plt
import pandas as pd
data = {"year":[2002,2000,1999,2020,2023],"age":[19,20,34,4,25]}
pandas_data = pd.DataFrame(data)
print(pandas_data)
plt.plot(data["year"],data["age"])
plt.show()
输出
year  age
0  2002   19
1  2000   20
2  1999   34
3  2020    4
4  2023   25

使用散点图
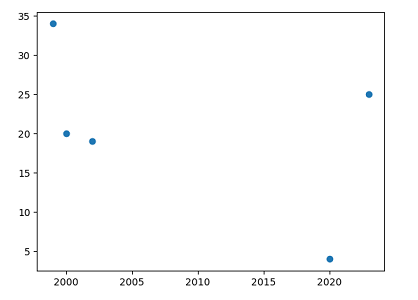
散点图用于绘制已定义数据元素之间的关系。我们在 matplotlib 库中有一个函数 scatter() 来绘制散点图。以下是语法。
plt.scatter(x,y)
示例
在下面的示例中,我们将使用 pandas 库的 Dataframe 功能创建散点图以可视化提供的数据。
import matplotlib.pyplot as plt
import pandas as pd
data = {"year":[2002,2000,1999,2020,2023],"age":[19,20,34,4,25]}
pandas_data = pd.DataFrame(data)
print(pandas_data)
plt.scatter(data["year"],data["age"])
plt.show()
输出
year  age
0  2002   19
1  2000   20
2  1999   34
3  2020    4
4  2023   25

使用直方图
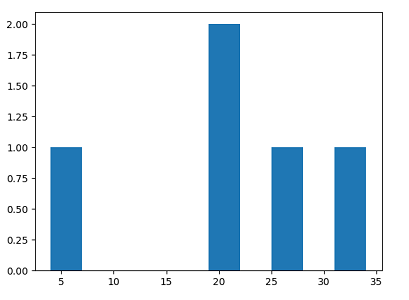
直方图用于显示图上单个变量的分布。在 matplotlib 库中,我们有 hist() 函数来绘制直方图。以下是语法。
plt.hist(x)
示例
在此示例中,我们将使用 matplotlib 库中提供的 hist() 函数绘制直方图。
import matplotlib.pyplot as plt
import pandas as pd
data = {"year":[2002,2000,1999,2020,2023],"age":[19,20,34,4,25]}
pandas_data = pd.DataFrame(data)
print(pandas_data)
plt.hist(data["age"])
plt.show()
输出
year  age
0  2002   19
1  2000   20
2  1999   34
3  2020    4
4  2023   25

使用条形图
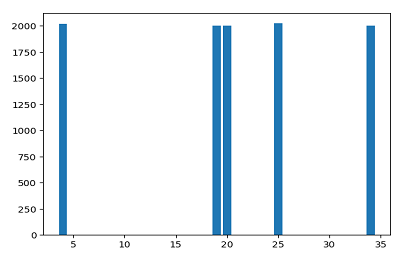
条形图用于比较不同类别的数据。Matplotlib 库提供了一个用于绘制条形图的函数 bar()。以下是语法 -
plt.bar(x,y)
示例
在此示例中,我们将使用 matplotlib 库中提供的 bar() 函数绘制条形图。
import matplotlib.pyplot as plt
import pandas as pd
data = {"year":[2002,2000,1999,2020,2023],"age":[19,20,34,4,25]}
pandas_data = pd.DataFrame(data)
print(pandas_data)
plt.bar(data["age"],data["year"])
plt.show()
输出
year  age
0  2002   19
1  2000   20
2  1999   34
3  2020    4
4  2023   25


