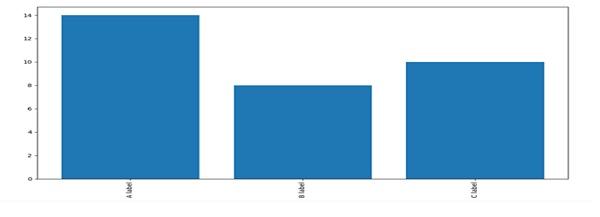
Python/Matplotlib 中带有垂直标签的条形图
pythonmatplotlibserver side programmingprogramming
首先,我们可以使用 plt.bar 和 xticks 创建条形图。然后,我们可以通过在 “rotation” 键中设置 “vertical” 或 “horizontal” 属性来对齐标签。
步骤
使用数字创建列表、bars_heights 和 bars_label。
使用 bar() 方法创建条形图,其中包含 bars_heights 和 bars_label 的长度。
使用 xticks() 和 rotation='vertical' 获取或设置 X 轴的当前刻度位置和标签和 bars_label。
要显示图表,请使用 plt.show() 方法。
示例
from matplotlib import pyplot as plt

bars_heights = [14, 8, 10]
bars_label = ["A label", "B label", "C label"]

plt.bar(range(len(bars_label)), bars_heights)
plt.xticks(range(len(bars_label)), bars_label, rotation='vertical')
plt.show()
输出


