Julia 编程 - 绘图
Julia 有各种用于绘图的软件包,在开始绘图之前,我们需要首先下载并安装其中一些软件包,如下所示 −
(@v1.5) pkg> add Plots PyPlot GR UnicodePlots
包Plots是一个高级绘图包,也称为与其他绘图包的"后端"接口。 要开始使用 Plots 包,请输入以下命令 −
julia> using Plots
[ Info: Precompiling Plots [91a5bcdd-55d7-5caf-9e0b-520d859cae80]
Plotting a function
为了绘制函数,我们需要切换回 PyPlot 后端,如下所示−
  julia> pyplot()
Plots.PyPlotBackend()
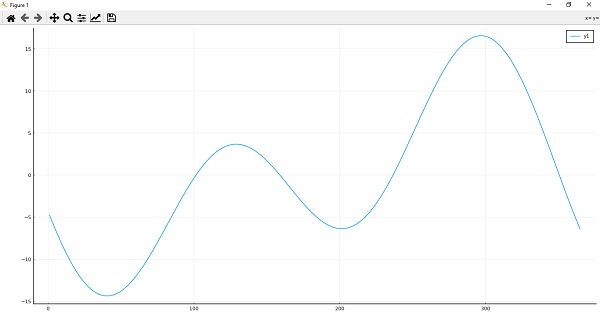
这里我们将绘制时间图的方程,可以通过以下函数建模 −
julia> eq(d) = -7.65 * sind(d) + 9.87 * sind(2d + 206);
julia> plot(eq, 1:365)
sys:1: MatplotlibDeprecationWarning: Passing the fontdict parameter of _set_ticklabels() positionally is deprecated since Matplotlib 3.3; the parameter will become keyword-only two minor releases later.
sys:1: UserWarning: FixedFormatter should only be used together with FixedLocator
Packages
每个人都想要一个可以帮助他们通过文本而不是图形快速绘制绘图的软件包。
UnicodePlots
Julia 提供了一个名为 UnicodePlots 的此类包,它可以生成以下内容 −
散点图
线图
条形图
阶梯图
直方图
稀疏模式
密度图
我们可以通过以下命令将其添加到我们的 Julia 安装中 −
(@v1.5) pkg> add UnicodePlots
添加后,我们可以使用它来绘制图表,如下所示:
julia> using UnicodePlots
示例
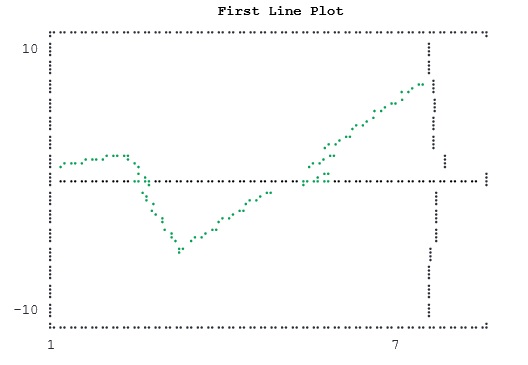
以下 Julia 示例使用 UnicodePlots 生成折线图。
julia> FirstLinePlot = lineplot([1, 2, 3, 7], [1, 2, -5, 7], title="First Line Plot", border=:dotted) First Line Plot
示例
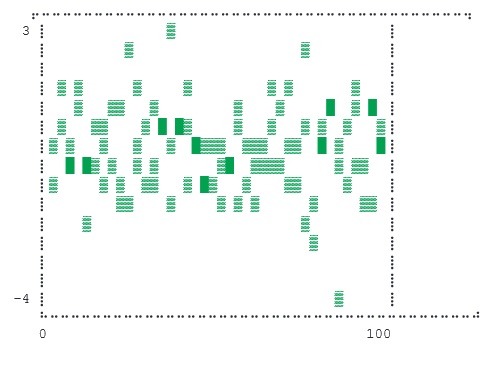
以下 Julia 示例使用 UnicodePlots 生成密度图表。
Julia> using UnicodePlots
Julia> FirstDensityPlot = densityplot(collect(1:100), randn(100), border=:dotted)
VegaLite
这个 Julia 包是一个可视化语法,它允许我们在 Web 浏览器窗口中创建可视化。 有了这个包,我们可以 −
以 JSON 格式描述数据可视化
使用 HTML5 Canvas 或 SVG 生成交互式视图
它可以产生以下结果 −
面积图
条形图/直方图
线图
散点图
饼图/圆环图
瀑布图
我们可以通过以下命令将其添加到我们的 Julia 安装中 −
(@v1.5) pkg> add VegaLite
添加后,我们可以使用它来绘制图表,如下所示 −
julia> using VegaLite
示例
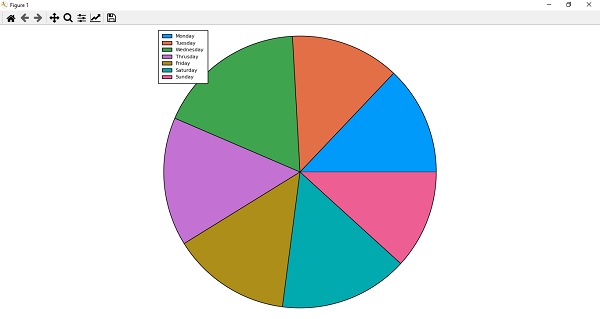
以下 Julia 示例使用 VegaLite 生成饼图。
julia> X = ["Monday", "Tuesday", "Wednesday", "Thrusday", "Friday","Saturday","Sunday"];

julia> Y = [11, 11, 15, 13, 12, 13, 10]
7-element Array{Int64,1}:
 11
 11
 15
 13
 12
 13
 10


julia> P = pie(X,Y)