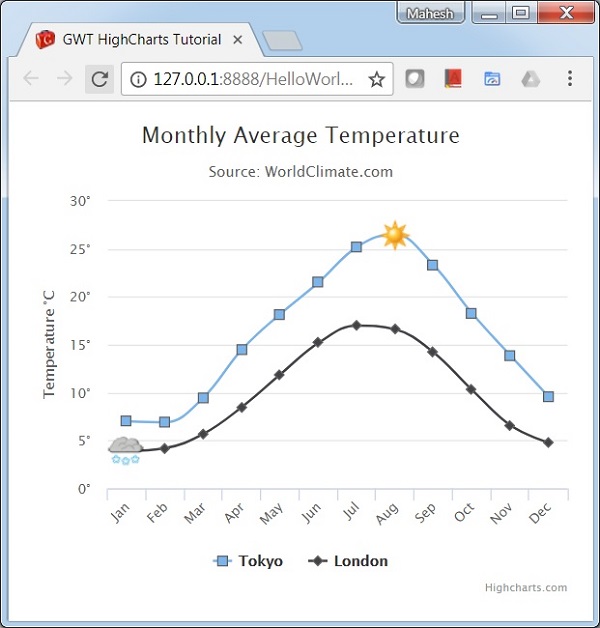
GWT Highcharts - 带符号的样条图
我们已经在Highcharts 配置语法一章中看到了用于绘制此图表的配置。现在让我们考虑以下示例,以进一步了解带符号的样条图。
配置
使用 marker.symbol 属性向图表系列添加符号。它可以是预配置的符号,如"正方形"、"菱形"或图像的 URL。也可以在系列数据中的任何位置添加标记。
chart.createSeries()
   .setName("Tokyo")
   .setPlotOptions(
      new SplinePlotOptions()
      .setMarker(
         new Marker()
            .setSymbol(Marker.Symbol.SQUARE)
      )
   )
示例
HelloWorld.java
package com.tutorialspoint.client;

import org.moxieapps.gwt.highcharts.client.Chart;
import org.moxieapps.gwt.highcharts.client.Point;
import org.moxieapps.gwt.highcharts.client.Series.Type;
import org.moxieapps.gwt.highcharts.client.ToolTip;
import org.moxieapps.gwt.highcharts.client.XAxis;
import org.moxieapps.gwt.highcharts.client.YAxis;

import org.moxieapps.gwt.highcharts.client.labels.AxisLabelsData;
import org.moxieapps.gwt.highcharts.client.labels.AxisLabelsFormatter;
import org.moxieapps.gwt.highcharts.client.labels.YAxisLabels;
import org.moxieapps.gwt.highcharts.client.plotOptions.Marker;
import org.moxieapps.gwt.highcharts.client.plotOptions.SplinePlotOptions;

import com.google.gwt.core.client.EntryPoint;
import com.google.gwt.user.client.ui.RootPanel;

public class HelloWorld implements EntryPoint {
   public void onModuleLoad() {
      Chart chart = new Chart()
         .setType(Type.SPLINE)
         .setChartTitleText("Monthly Average Temperature")
         .setChartSubtitleText("Source: WorldClimate.com");

      XAxis xAxis = chart.getXAxis();
         xAxis.setCategories("Jan", "Feb", "Mar", "Apr", "May", "Jun",
            "Jul", "Aug", "Sep", "Oct", "Nov", "Dec");

      YAxis yAxis = chart.getYAxis();
      yAxis.setAxisTitleText("Temperature °C");
      yAxis.setLabels(
         new YAxisLabels()
         .setFormatter(new AxisLabelsFormatter() {
            @Override
            public String format(AxisLabelsData axisLabelsData) {
               return axisLabelsData.getValueAsLong() + "°";
            }
         })
      );

      ToolTip toolTip = new ToolTip();
      toolTip.setValueSuffix("°C")
         .setCrosshairs(true)
         .setShared(true);

      chart.setToolTip(toolTip);

      chart.setSplinePlotOptions(new SplinePlotOptions()
         .setMarker(
         new Marker()
            .setRadius(4)
            .setLineColor("#666666")
            .setLineWidth(1)
         )
      );

      chart.addSeries(
         chart.createSeries()
            .setName("Tokyo")
            .setPlotOptions(
               new SplinePlotOptions()
               .setMarker(
                  new Marker()
                  .setSymbol(Marker.Symbol.SQUARE)
               )
            )
         .setPoints(
            new Point[]{
               new Point(7.0),
               new Point(6.9),
               new Point(9.5),
               new Point(14.5),
               new Point(18.2),
               new Point(21.5),
               new Point(25.2),
               new Point(26.5)
               .setMarker(
                  new Marker()
                     .setSymbol("http://highcharts.com/demo/gfx/sun.png")
               ),
               new Point(23.3),
               new Point(18.3),
               new Point(13.9),
               new Point(9.6)
            }
         )
      );

      chart.addSeries(
         chart.createSeries()
            .setName("London")
            .setPlotOptions(
               new SplinePlotOptions()
                  .setMarker(
                     new Marker()
                        .setSymbol(Marker.Symbol.DIAMOND)
                  )
            )
            .setPoints(
               new Point[]{
                  new Point(3.9)
                  .setMarker(
                     new Marker()
                        .setSymbol("http://highcharts.com/demo/gfx/snow.png")
                  ),
                  new Point(4.2),
                  new Point(5.7),
                  new Point(8.5),
                  new Point(11.9),
                  new Point(15.2),
                  new Point(17.0),
                  new Point(16.6),
                  new Point(14.2),
                  new Point(10.3),
                  new Point(6.6),
                  new Point(4.8),
               }
            )
      );
      RootPanel.get().add(chart);
   }
}
结果
验证结果。
 gwt_highcharts_line_charts.html


