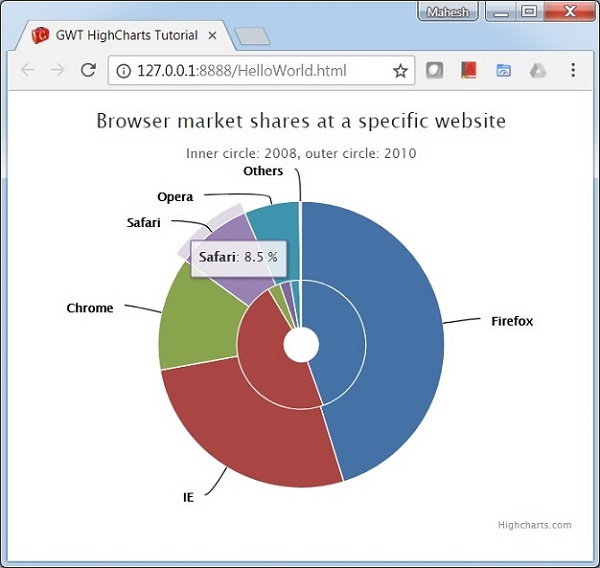
GWT Highcharts - 环形图
以下是环形图的示例。
我们已经在Highcharts 配置语法一章中看到了用于绘制图表的配置。
下面给出了环形图的示例。
配置
现在让我们看看采取的其他配置/步骤。
chart
将图表类型配置为基于"饼图"。chart.type 决定图表的系列类型。在这里,默认值为"线"。
chart.setType(Type.PIE);
示例
HelloWorld.java
package com.tutorialspoint.client;

import org.moxieapps.gwt.highcharts.client.Chart;
import org.moxieapps.gwt.highcharts.client.Legend;
import org.moxieapps.gwt.highcharts.client.Point;
import org.moxieapps.gwt.highcharts.client.Series.Type;
import org.moxieapps.gwt.highcharts.client.Style;

import org.moxieapps.gwt.highcharts.client.ToolTip;
import org.moxieapps.gwt.highcharts.client.ToolTipData;
import org.moxieapps.gwt.highcharts.client.ToolTipFormatter;

import org.moxieapps.gwt.highcharts.client.labels.DataLabels;
import org.moxieapps.gwt.highcharts.client.labels.DataLabelsData;
import org.moxieapps.gwt.highcharts.client.labels.DataLabelsFormatter;
import org.moxieapps.gwt.highcharts.client.labels.PieDataLabels;
import org.moxieapps.gwt.highcharts.client.labels.Labels.Align;
import org.moxieapps.gwt.highcharts.client.labels.XAxisLabels;

import org.moxieapps.gwt.highcharts.client.plotOptions.ColumnRangePlotOptions;
import org.moxieapps.gwt.highcharts.client.plotOptions.PiePlotOptions;
import org.moxieapps.gwt.highcharts.client.plotOptions.PlotOptions.Cursor;

import com.google.gwt.core.client.EntryPoint;
import com.google.gwt.i18n.client.NumberFormat;
import com.google.gwt.user.client.ui.RootPanel;

public class HelloWorld implements EntryPoint {
   public void onModuleLoad() {
      final Chart chart = new Chart()
         .setType(Type.PIE)
         .setMargin(50, 0, 0, 0)
         .setChartTitleText("Browser market shares at a specific website")
         .setChartSubtitleText("Inner circle: 2008, outer circle: 2010")
         .setPlotBackgroundColor("none")
         .setPlotBorderWidth(0)
         .setPlotShadow(false)
         .setToolTip(new ToolTip()
            .setFormatter(new ToolTipFormatter() {
            @Override
            public String format(ToolTipData toolTipData) {
               return "<b>" + toolTipData.getPointName() + "</b>: " + toolTipData.getYAsDouble() + " %";
            }
         })
      );

      chart.addSeries(chart.createSeries()
         .setName("2008")
         .setPlotOptions(new PiePlotOptions()
            .setCenter(.5, .5)
            .setSize(.45)
            .setInnerSize(.20)
            .setDataLabels(new DataLabels()
               .setEnabled(false)
            )
         )
         .setPoints(new Point[]{
            new Point("Firefox", 44.2).setColor("#4572A7"),
            new Point("IE", 46.6).setColor("#AA4643"),
            new Point("Chrome", 3.1).setColor("#89A54E"),
            new Point("Safari", 2.7).setColor("#80699B"),
            new Point("Opera", 2.3).setColor("#3D96AE"),
            new Point("Others", 0.4).setColor("#DB843D")
         })
      );

      chart.addSeries(chart.createSeries()
         .setName("2010")
         .setPlotOptions(new PiePlotOptions()
            .setCenter(.5, .5)
            .setInnerSize(.45)
            .setPieDataLabels(new PieDataLabels()
               .setEnabled(true)
               .setColor("#000000")
               .setConnectorColor("#000000")
            )
         )
         .setPoints(new Point[]{
            new Point("Firefox", 45.0).setColor("#4572A7"),
            new Point("IE", 26.8).setColor("#AA4643"),
            new Point("Chrome", 12.8).setColor("#89A54E"),
            new Point("Safari", 8.5).setColor("#80699B"),
            new Point("Opera", 6.2).setColor("#3D96AE"),
            new Point("Others", 0.2).setColor("#DB843D")
         })
      );
      RootPanel.get().add(chart);
   }
}
结果
验证结果。
 gwt_highcharts_pie_charts.html


